Master the Art of
Trading Strong Momentum with Price Action
Stop chasing weak trends. Read price action the right way. Spot genuine momentum, filter out the noise, and always know what to trade, when to trade, and when to stay out – using clearly defined rules.
2 hours
4 Chapters
Hindi
Breakout Strategy | Noiseless Trading | Anchor Column | D-Smart Line
Course price :
₹2499 /-
₹399/- (incl. GST)
Watch Trailer
See how mastering breadth and price action can help you trade with clarity, confidence, and consistency, no matter how the market moves.
Curriculum
Time the market with Noiseless Charts
Traditional charts move as price changes with time, creating constant fluctuations with even the most minor changes causing you to doubt every move. This course explores a price-only method that filters out time and noise, helping you focus purely on trend, momentum, and structure.
- Spot strong trends with objective signals
- Filter false signals with D-Smart Line (our proprietary trend-filtration tool)
- Know exactly when to enter the trade and when to wait
- Spot momentum early using noiseless chart patterns
- Practical examples
- For Novice to Seasoned Traders & Investors
Breakout Strategy | Noiseless Trading | Anchor Column | D-Smart Line
What is this course?
Most traders struggle because they’re constantly bombarded with conflicting signals. This course focuses on simplifying their journey. You will learn to read price-action and use objective tools to remove impulsive emotions and replacing them with calm, rule-based execution. You will explore how to time your trades on objective signals, how to manage risk for every trade and transform from stressful guesswork to calm, confident decisions.
- Spot powerful momentum early
- Eliminate maximum market noise and whipsaws
- One noiseless strategy for all timeframes
- Find setups in seconds with built-in scanners
- Execute with clarity on entry, exit and risk management
- Detect false rallies and weak breakouts
You don’t need more indicators
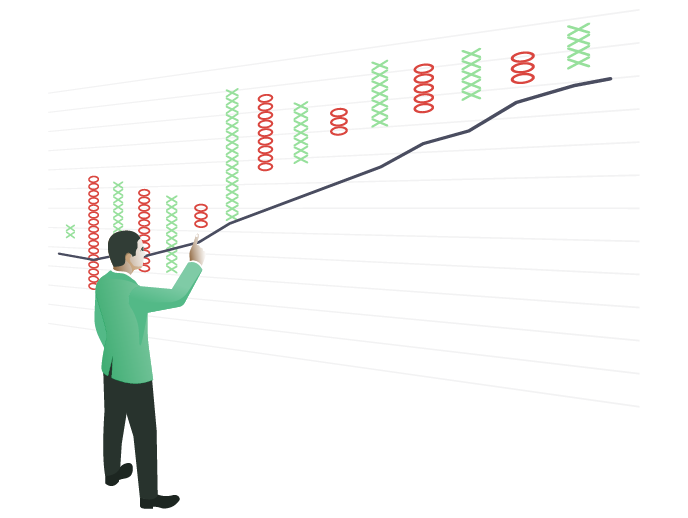
Your charts are full of indicators that give contradictory signals. The problem is not the indicators; it is your chart. Traditional charts plot price along with time, so the chart fluctuates even if the price does nothing significant. This creates noise, making you doubt your system and decisions.
This course fixes that – When you remove time from the chart, this “noise” disappears, showing you only the trend that matters. Noiseless charts like Point & Figure reveal the underlying trend with clarity, helping you follow momentum instead of predicting it. Combine this with the D-Smart Line, an objective indicator that makes every decision binary, and you have a price action system that works cleanly across all timeframes.
No emotions. No second-guessing – You enter when price action confirms momentum, trail your stop as it climbs and exit when the pattern breaks. Choppy markets that bleed capital? You avoid them. Trading stops feeling like chaos and starts feeling like following a map.
Turn Uncertainty into Strategy
By the end of this course, you will grow into a trader that makes data-driven decisions.
You will –
• Stop guessing and start trading with confidence, using clear signals.
• Understand market context—whether to trade, hold, or stay out.
• Learn to minimize whipsaws and avoid trading in extreme zones.
• Use dynamic trailing stops that follow price and preserve profits.
• Master tools to identify real trends—and stay with them.
• Adopt better risk management by syncing breadth with price action.
This isn’t just a strategy. It’s a trading framework for real-world markets.
About Your Mentor
Raju Ranjan, a seasoned trader and market strategist, is the Chief Product Officer at Definedge with an extensive experience of 18+ years with a background in quantitative analysis, he has developed a unique, practical approach that helps cut noise, manage risk and stay with trends. Raju is known for his simple teaching style, visual clarity and disciplined frameworks and has trained over 10,000 traders over the years.
Frequently Asked Questions
Are the strategies taught in the course applicable to options?
Yes. You can use the strategies taught in this course across all instruments - stocks, indices, commodities and options – and across all timeframes.
What is the "D-Smart Line"?
The D-Smart Line is a proprietary indicator created by Definedge. It is a noiseless a chart specific indicator that shows market trend effectively. To learn more about this indicator, visit our library.
Is this course suitable for beginners?
Yes, the course is designed for all experience levels, including beginners. It breaks down complex concepts into simple, actionable steps.
Is this a certified course?
Yes. After the successful completion of the course and its final assessment, you will gain a certification for the course.
Are the charts & indicators used in the course FREE?
Yes, the tools and charts used in this course are available FREE across all the trading terminals in the Definedge universe. To access it, all you need is a Definedge demat.
What is the prerequisite for enrolling in this course?
Though this course is designed for traders and investors of all levels, a foundational knowledge of the markets will expedite your learning process.
How long can I access this course?
This is a self-paced course, and you can choose access for 1 year or Lifetime (both charged differently) from your date of enrollment.