Looking at the last 30 years of Nifty data, October to December has historically been the strongest quarter, with an average return of around 5%. Nifty has ended this period on a positive note in 19 out of 30 years. However, seasonality does not guarantee positive returns. In 2008, Nifty fell 24.5% during this quarter, while in the last 10 years, it delivered positive returns in 6 years. So, while historical trends suggest a positive bias towards year-end, price action should remain the key factor in trading decisions.
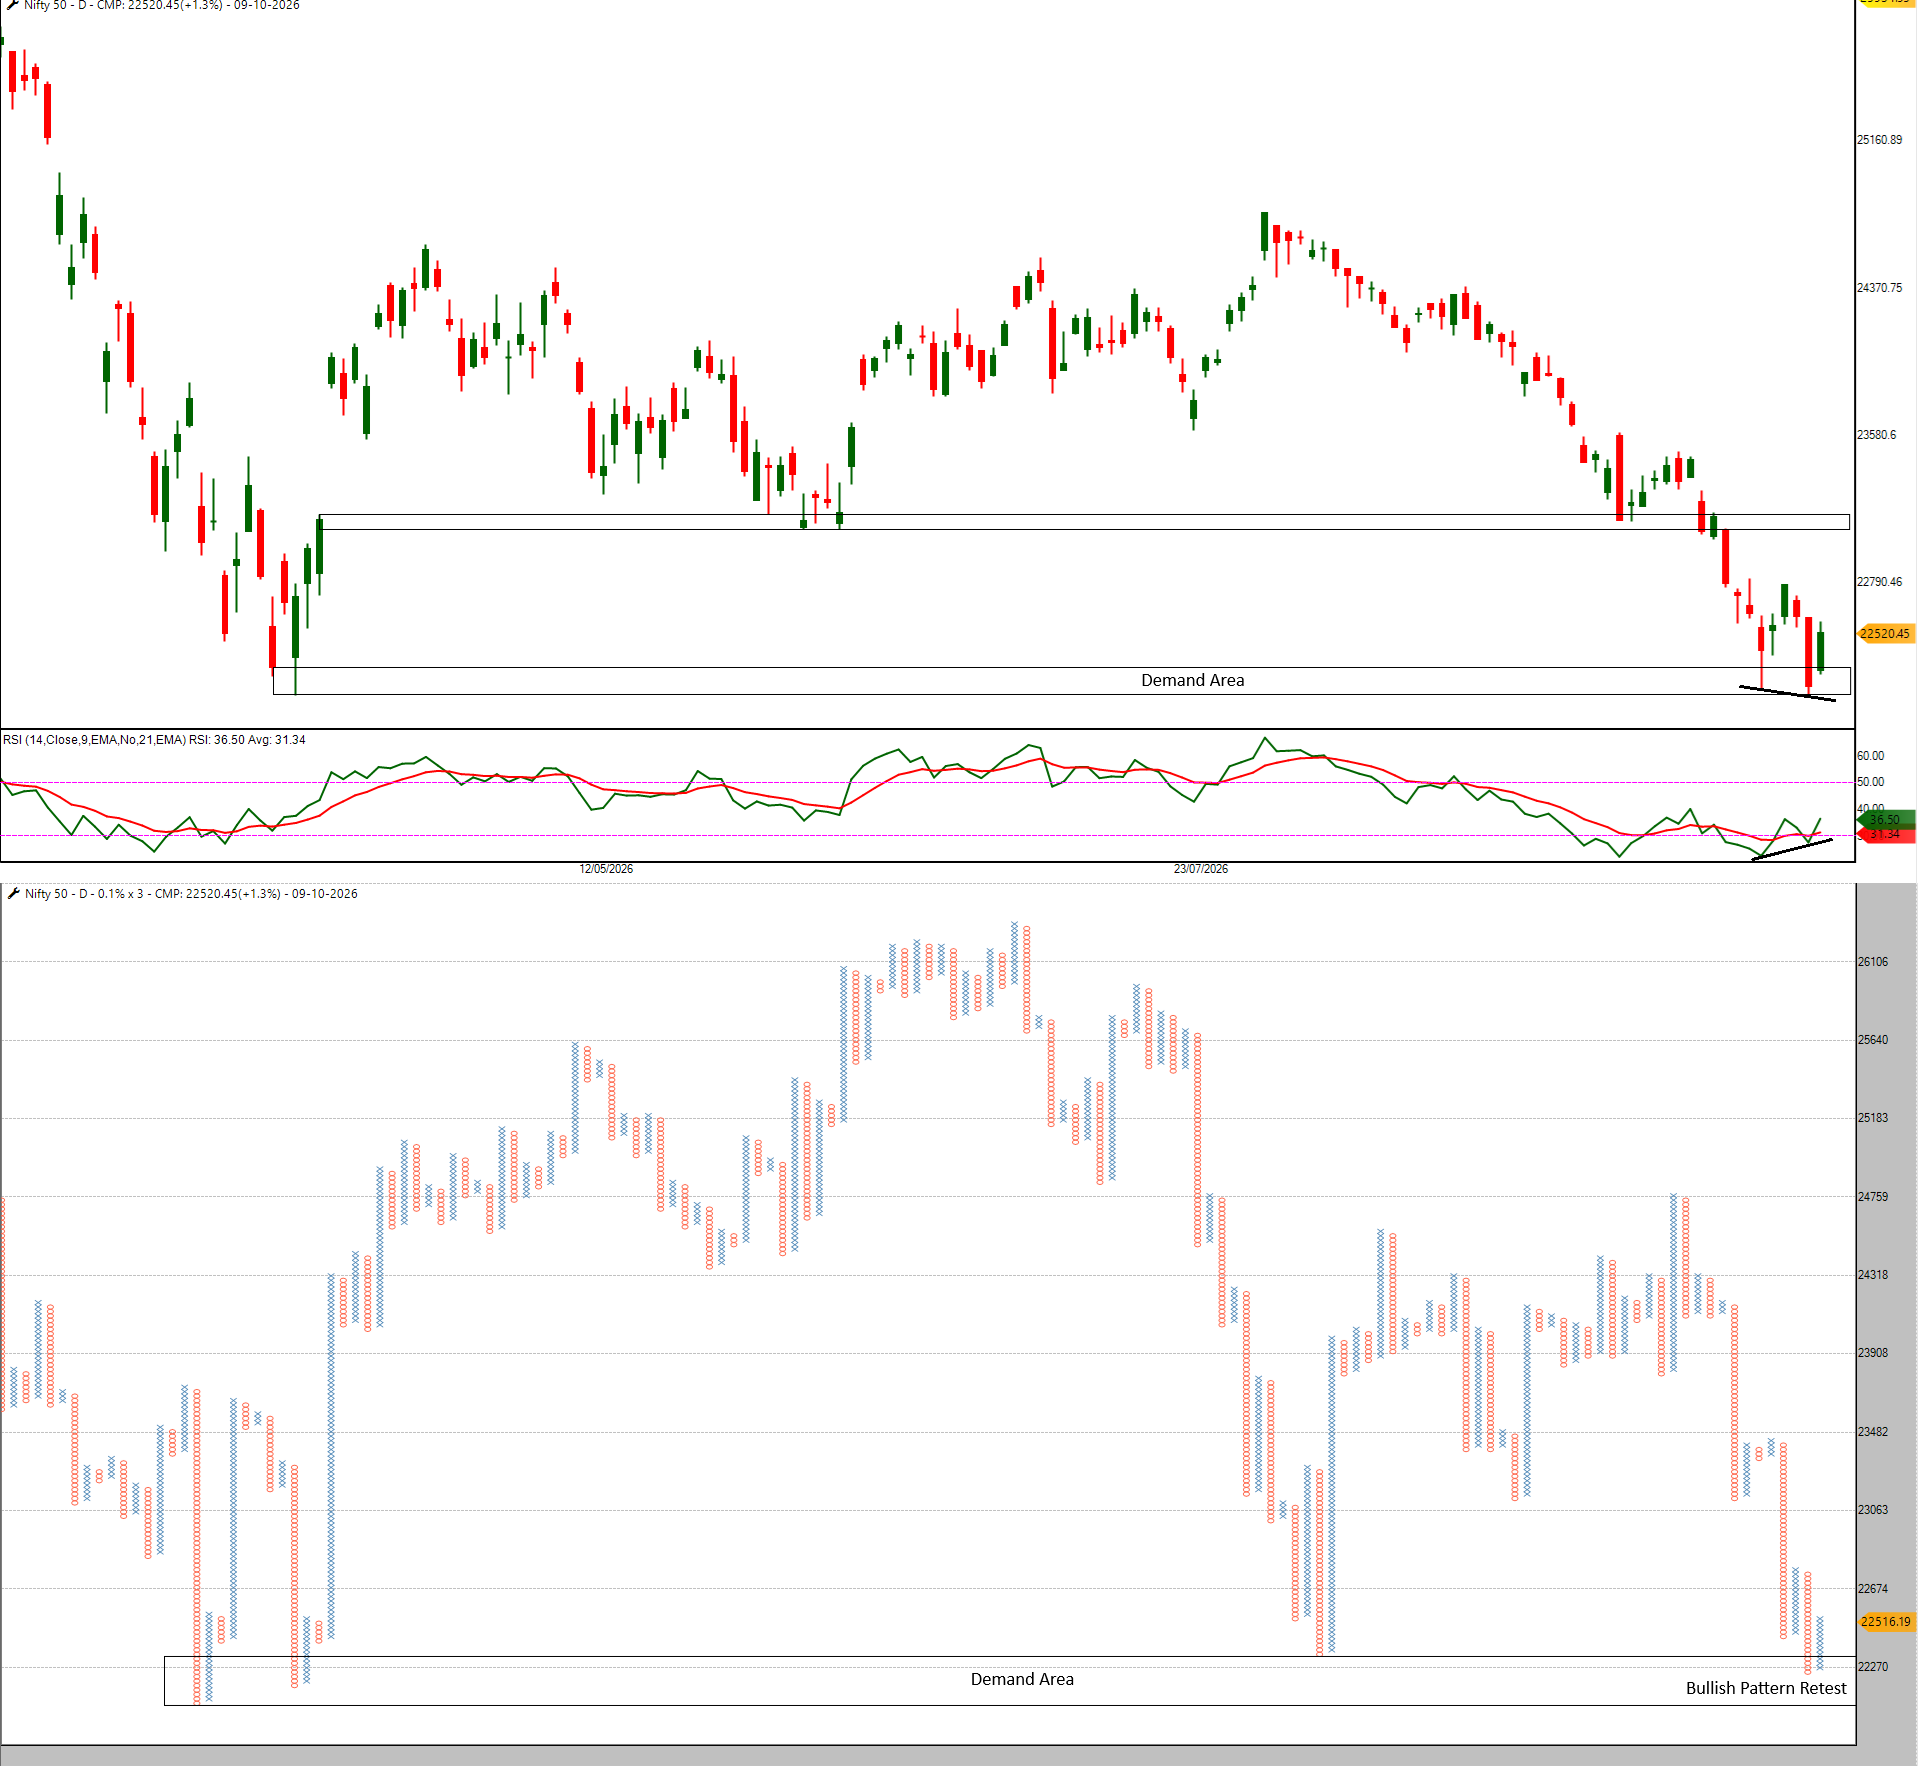
In our previous newsletter, we highlighted 22,150–22,300 as an important support zone for Nifty. As expected, the index found support around this area. The RSI is also showing a positive divergence, indicating the possibility of a recovery.
As long as Nifty holds above this support zone, a move towards 22,700–22,800 is possible. A breakout above 22,800 could open the door towards 23,000–23,050. However, a clear break below 22,150 could bring fresh weakness.
Levels to Watch:
Immediate Resistance: 22,700–22,800
Above 22,800: Upside towards 23,000–23,050
Immediate Support: 22,150–22,300
Below 22,150: Downside towards 22,000–21,750
BANKNIFTY SHORT TERM VIEW
The uncertainty around the RBI policy decision is now over. On October 7, the RBI increased the repo rate by 25 basis points to 5.50% and changed its policy stance to “calibrated tightening”, indicating that further rate cuts are unlikely in the near term. This marks the first rate hike after the previous easing cycle, during which rates were reduced from 6.50% to 5.25%. With the policy announcement behind us, the market can now focus more on price action and the broader trend.
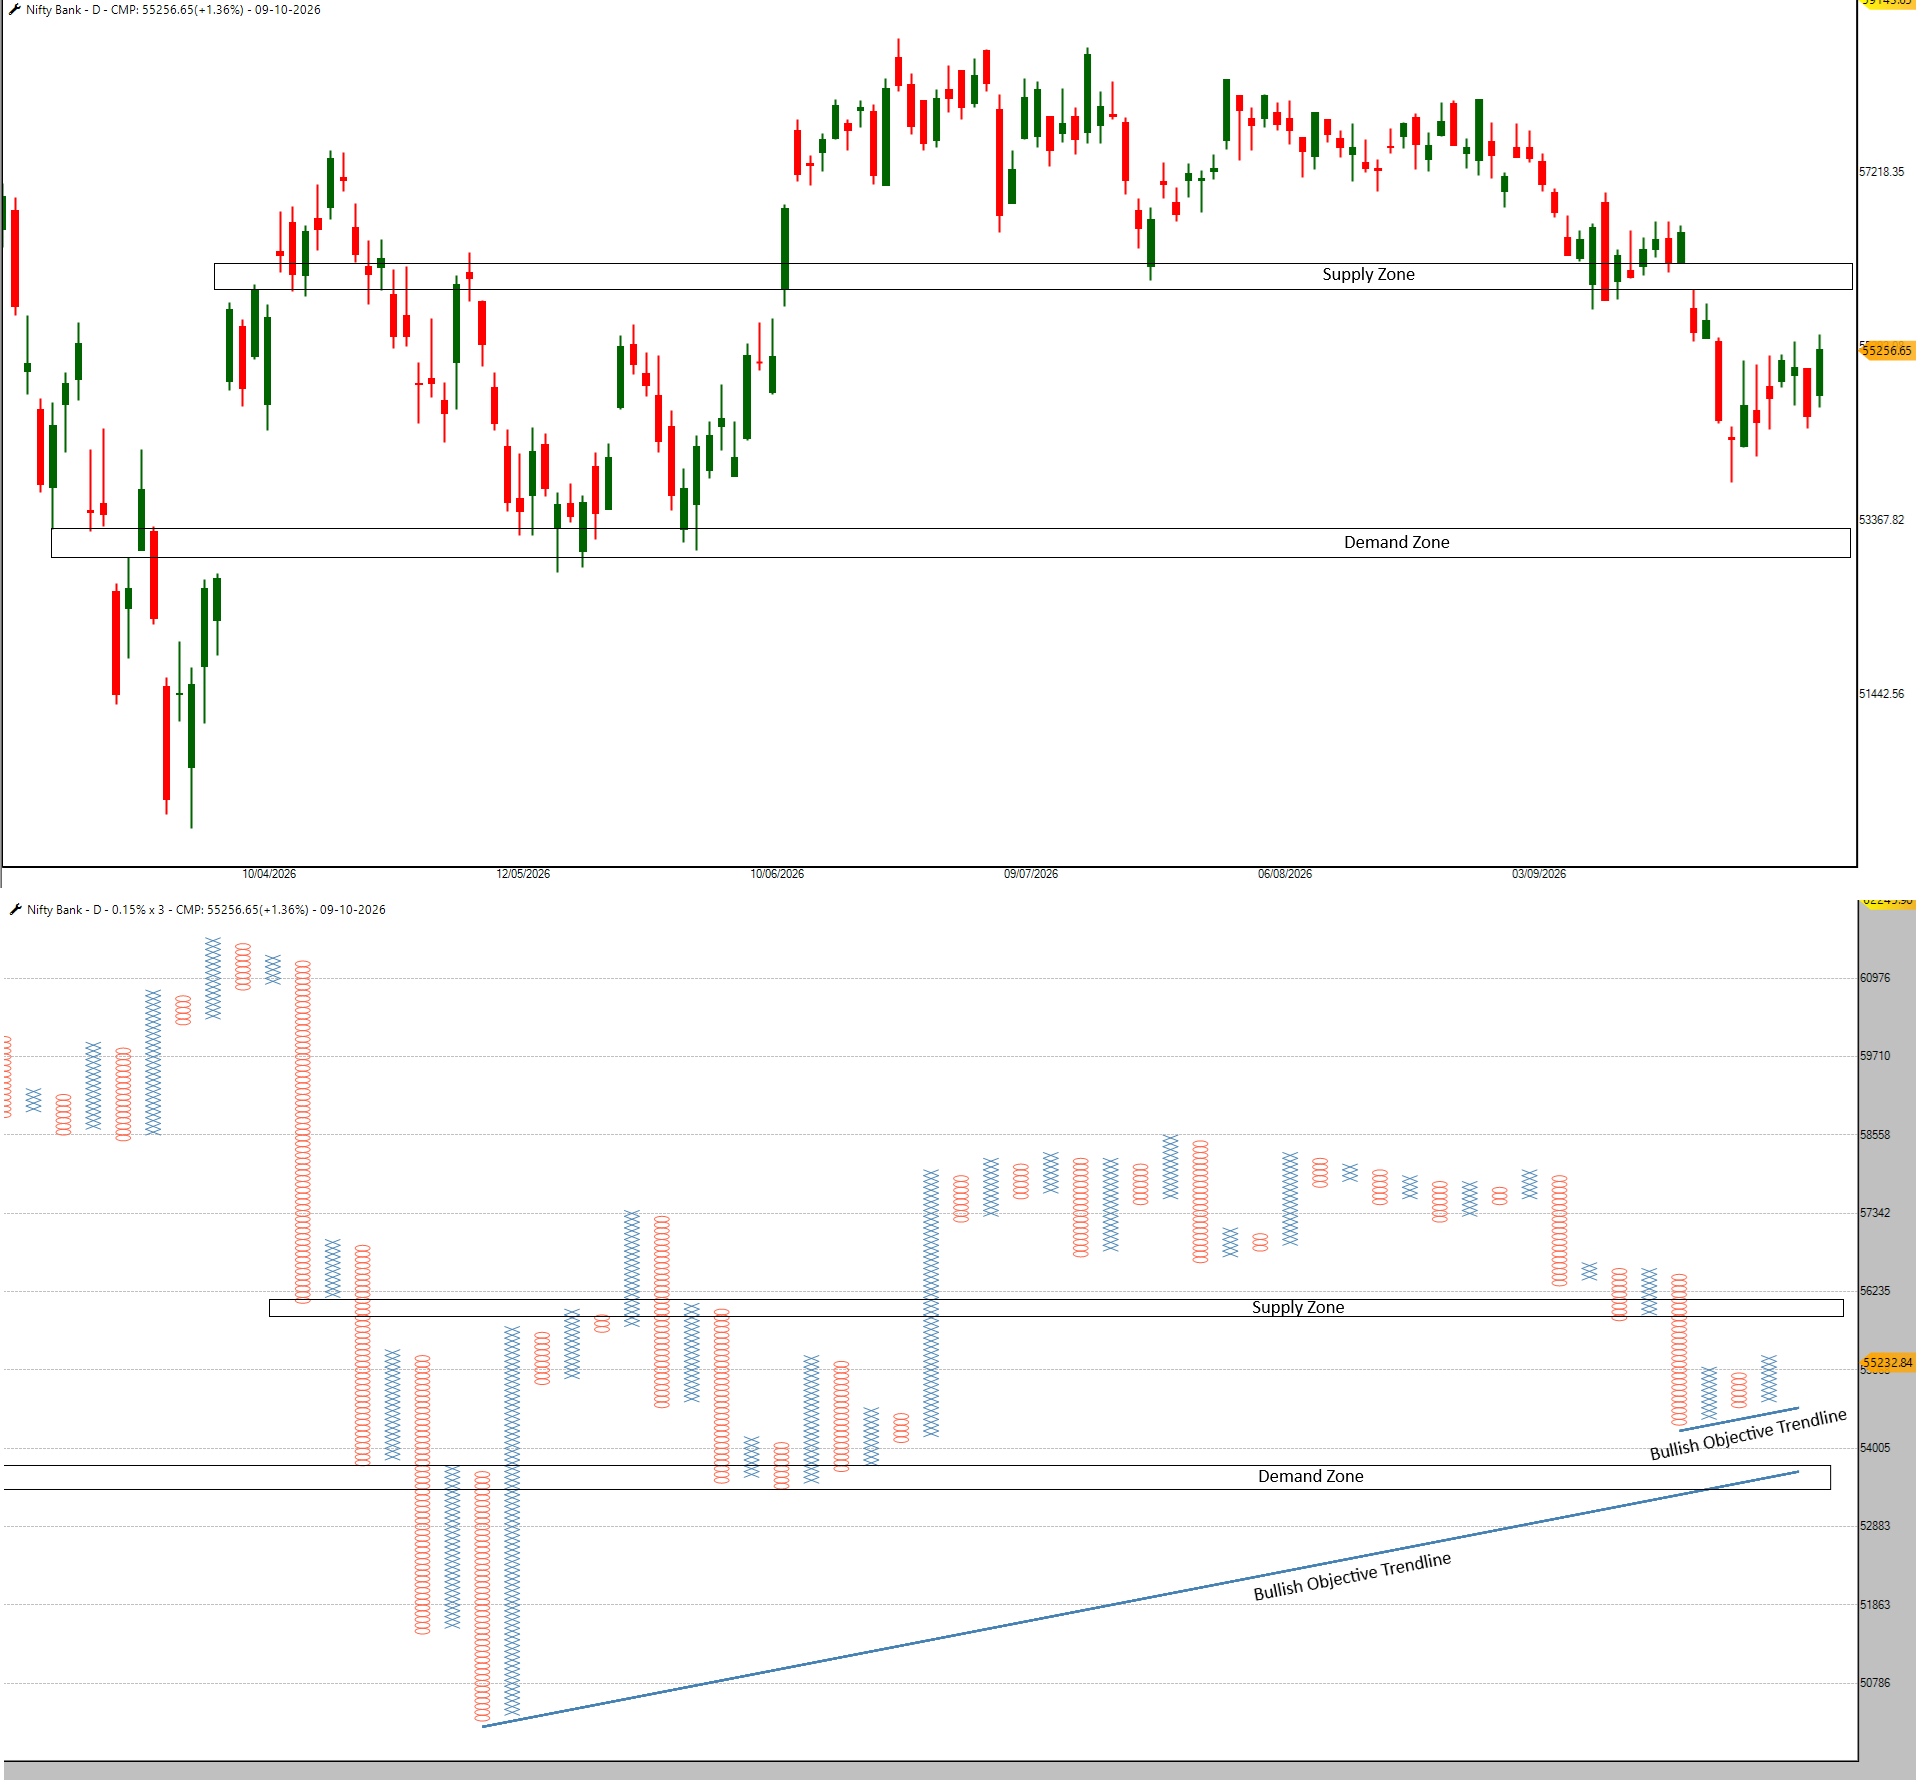
On the technical front, Bank Nifty continues to outperform Nifty 50, showing relative strength. The index is currently trading above its bullish objective trendline, and holding above this trendline will be important for further upside.
Even if the trendline breaks, another bullish objective trendline is placed near the key demand zone of 53,500–53,700, making this an important support area. As long as this zone holds, a recovery towards 55,500–55,750 remains possible. A breakout above 55,750 could extend the move towards 55,950–56,200. However, a decisive break below 53,500 could lead to further weakness.
Levels to Watch:
Immediate Resistance: 55,500–55,750
Above 55,750: Upside towards 55,950–56,200
Immediate Support: 53,500–53,700
Below 53,500: Further downside pressure possible
Market Breadth
NIFTY 500 MARKET BREADTH
P&F X% Breadth
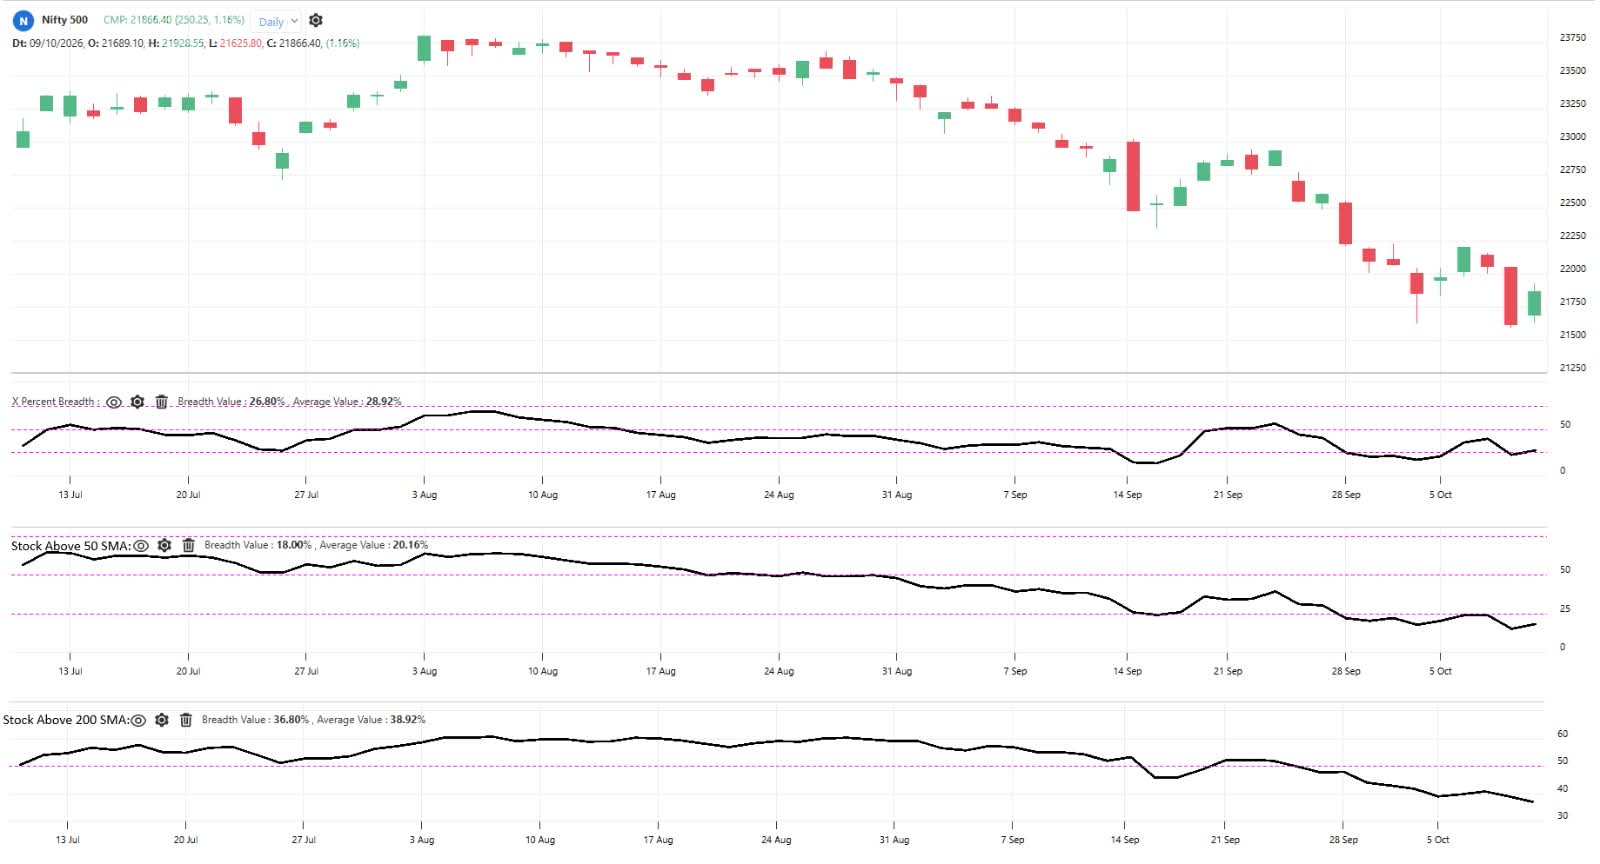
The P&F X% Breadth Indicator is currently at 26.80%, with around 134 stocks in the X column. The indicator improved from 16.60% last week, but it remains in the oversold zone, indicating that short-term market breadth is still weak. This recovery shows some improvement, although broader participation remains limited.
Stocks Above 50-Day Moving Average
The Stocks Above 50-Day Moving Average indicator is currently at 18.00%, with around 90 stocks trading above their 50-day moving average. The indicator declined from 20.00% last week and remains in the oversold zone, reflecting continued weakness in medium-term market participation.
Stocks Above 200-Day Moving Average
The Stocks Above 200-Day Moving Average indicator is currently at 36.80%, with around 184 stocks trading above their 200-day moving average. The indicator declined from 38.20% last week and remains below the 50% level, indicating that long-term market participation continues to weaken.
Overall
Overall, market breadth remains weak, with only a modest recovery in P&F X% Breadth compared to the previous week. The 50-Day Moving Average breadth has declined further, while the 200-Day Moving Average breadth continues to weaken. With both X% Breadth and 50-Day Moving Average breadth in oversold zones, market participation remains weak across short, medium and long-term measures.
RELATIVE STRENGTH OF MAJOR ASSET CLASSES:
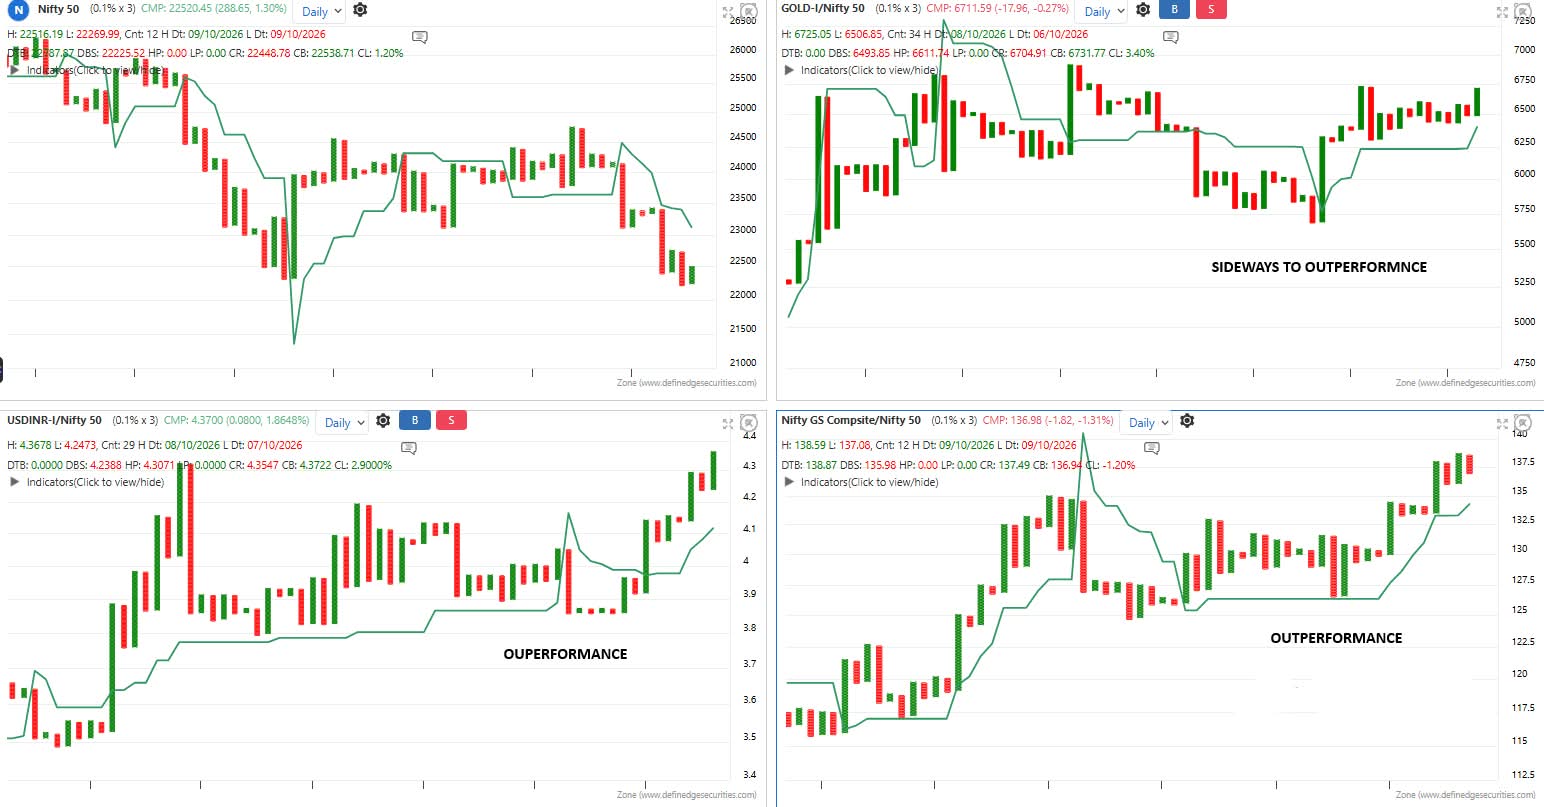
Nifty 50 (Top-Left Chart)
The Nifty 50 has turned positive in the current column, showing some improvement in the short-term price movement. However, the index remains below the D-Smart line, so the overall trend continues to remain weak. The Nifty 50 X% Breadth has recovered to 24% from the extreme oversold zone but remains weak, indicating limited improvement in market breadth. Fresh positional shorts should be avoided at these levels, as the market may see some price or time correction.
Gold vs Nifty 50 (Top-Right Chart)
The Gold/Nifty 50 RS chart continues to show outperformance and remains above the D-Smart line. The ratio is showing some improvement in relative strength, but it is still moving sideways after the earlier strong upmove. A breakout above the recent highs would further strengthen Gold’s outperformance against equities
USDINR vs Nifty 50 (Bottom-Left Chart)
The USDINR/Nifty 50 RS chart continues to show outperformance and is getting stronger. The ratio remains above the D-Smart line and has formed a positive column, indicating further improvement in its relative strength against the Nifty 50. As long as it stays above the D-Smart line, the outperformance remains intact.
Nifty G-Sec Composite vs Nifty 50 (Bottom-Right Chart)
The Nifty G-Sec Composite/Nifty 50 RS chart continues to show outperformance. After a strong upmove and a breakout, the ratio is now consolidating and has moved into a negative column. However, it remains above the D-Smart line, so the broader relative-strength setup continues to favour bonds over equities.
Overall
The intermarket setup remains negative for equities. Gold continues to outperform the Nifty 50, while USDINR is strengthening further and bonds are consolidating after their recent breakout. With all three asset classes still showing relative strength over equities, the outlook for the Nifty 50 remains weak. However, with X% Breadth recovering to 24% but still in the oversold zone, fresh positional shorts should be avoided at current levels. It would be better to wait for some price or time correction before taking a fresh directional view.
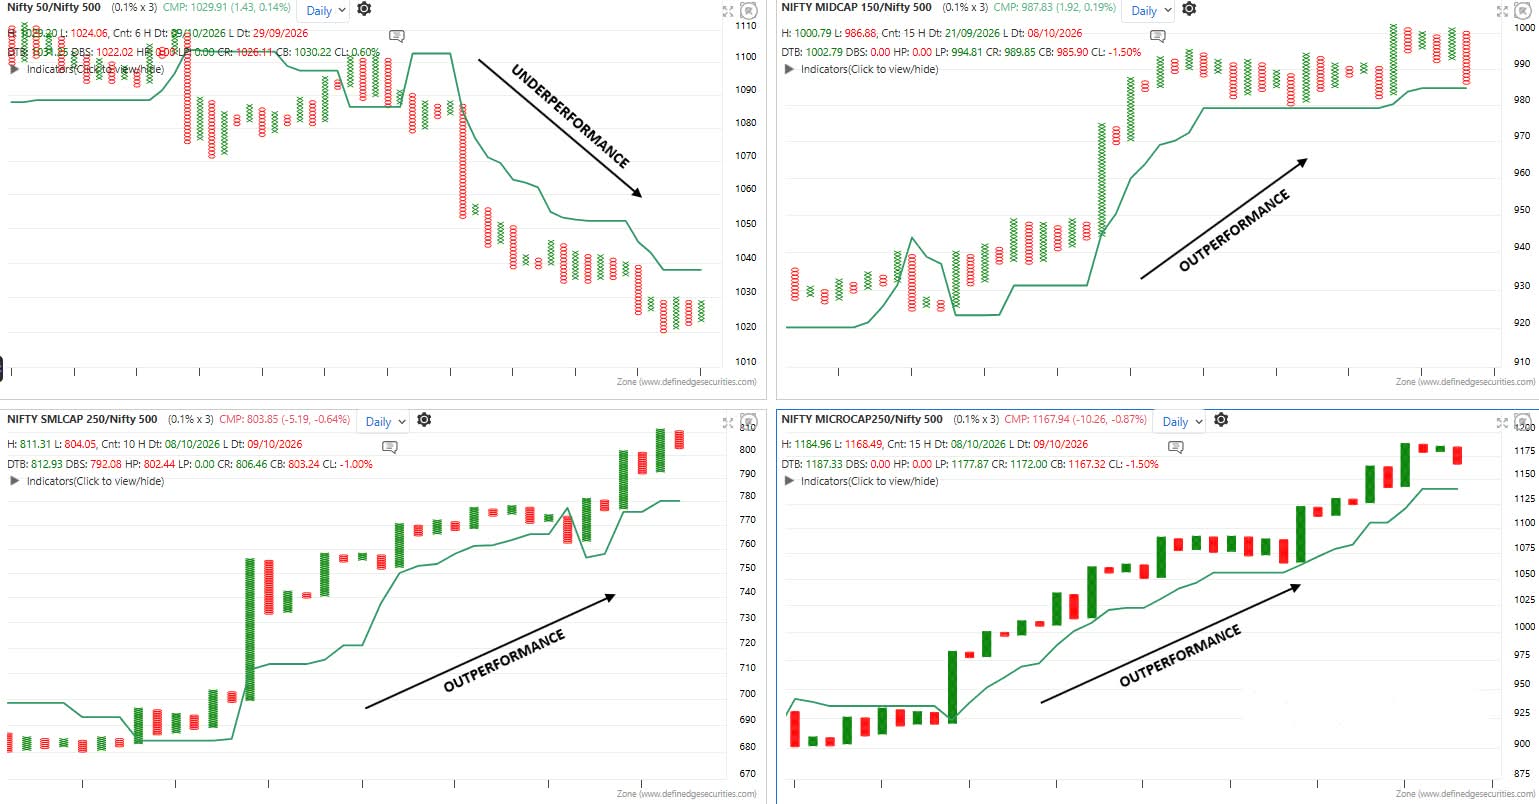
RELATIVE STRENGTH OF BROADER MARKET INDICES
Nifty 50 / Nifty 500 (Top-Left Chart)
The RS chart of Nifty 50 vs Nifty 500 continues to show underperformance by large-cap stocks. After a period of continuous weakening, the ratio is now consolidating at lower levels but remains below the D-Smart line, with no significant improvement in relative strength yet.
Nifty Midcap 150 / Nifty 500 (Top-Right Chart)
The Nifty Midcap 150 vs Nifty 500 RS chart continues to show outperformance. After the earlier strong rally, the ratio is now consolidating near its highs and has moved closer to the D-Smart line. Its relative strength remains positive, but further strength would help maintain the outperformance.
The Nifty Smallcap 250 vs Nifty 500 ratio continues to show strong outperformance. The chart remains above the D-Smart line and is still strengthening near its highs, indicating that relative strength continues to favour the Smallcap segment.
The Nifty Microcap 250 vs Nifty 500 RS chart continues to remain in an outperformance phase. The ratio is moving higher and remains above the D-Smart line, showing that Microcaps are maintaining strong relative performance.
Overall
Overall, Nifty Midcap 150, Smallcap 250 and Microcap 250 continue to outperform the Nifty 500, while Nifty 50 remains in an underperformance phase. Compared to the previous week, Nifty 50 is consolidating after its continuous decline, while Midcap is consolidating after a strong rally and is now closer to the D-Smart line. Smallcap and Microcap continue to strengthen, keeping their relative performance positive.
Sectors On Radar
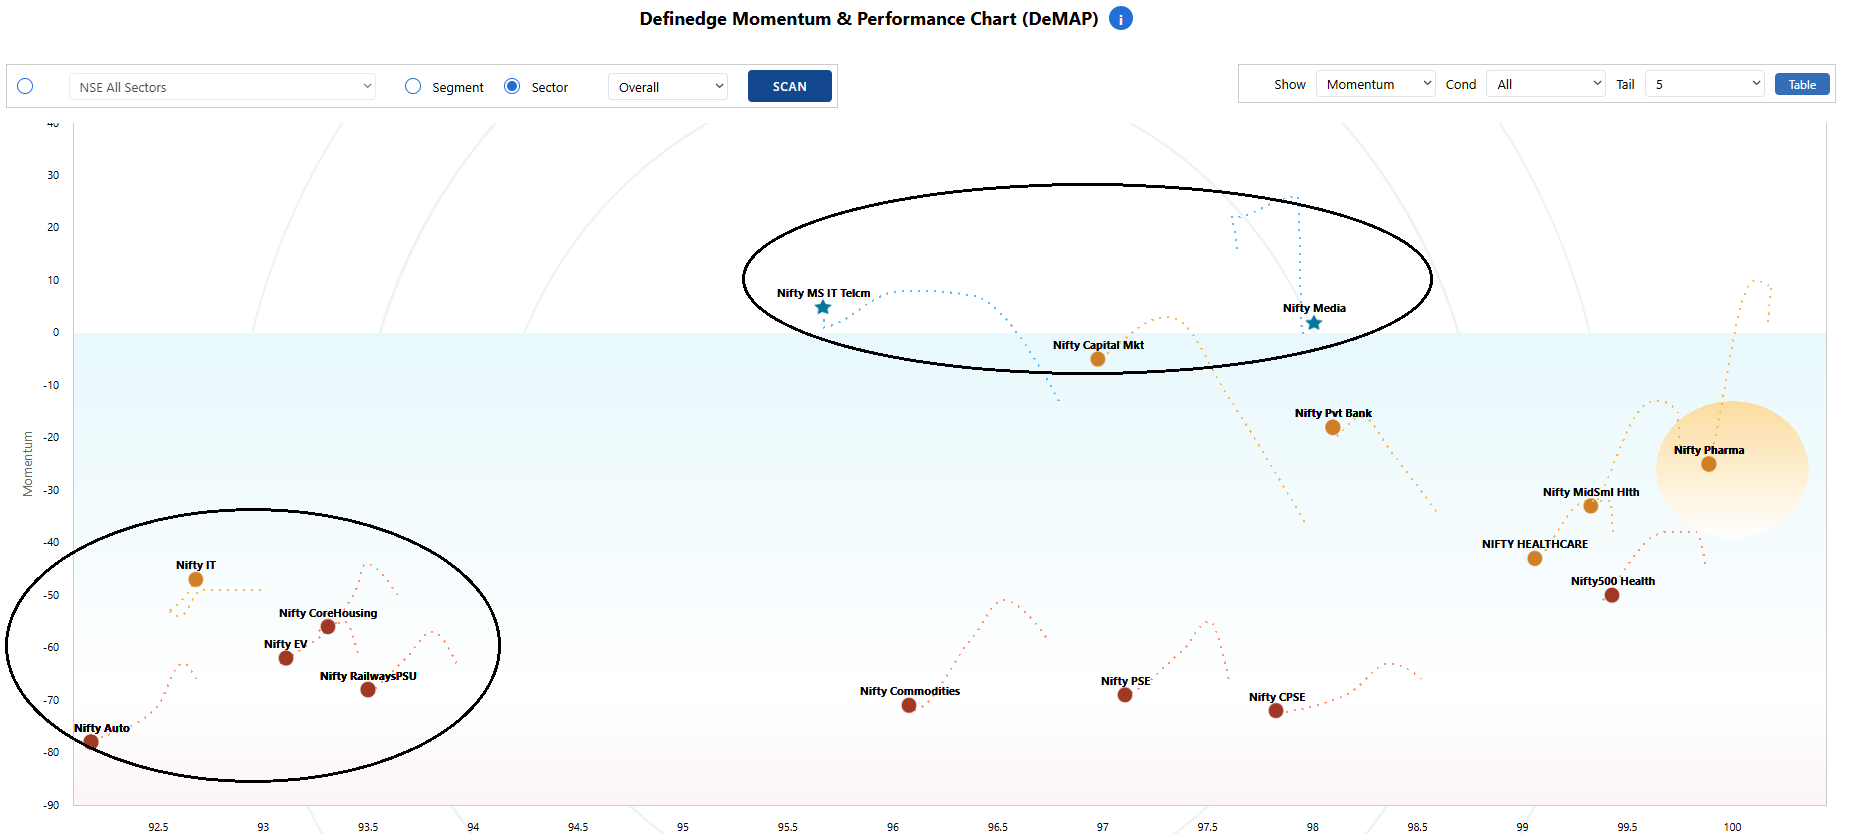
DEFINEDGE MOMENTUM AND PERFORMANCE CHART
Definedge Momentum and Performance (DeMAP) is a unique study developed by Definedge that helps you analyse the market at a glance. It combines price analysis, momentum, trend-following indicators, oscillators, Relative Strength,
Dynamic Relative Strength and other popular market factors to calculate Momentum and Performance levels.
DeMAP is divided into two zones, Sky and Water. Stocks above the zero line are in the Sky and shown as Stars, while those below are in the Water and shown as Circles. Green Stars indicate strong bullish momentum, Blue Stars semibullish, Red Circles bearish and Orange Circles semi-bearish.
The circle in each chart acts like a Sun, with its position indicating the sector's stance left for bullish, middle for neutral
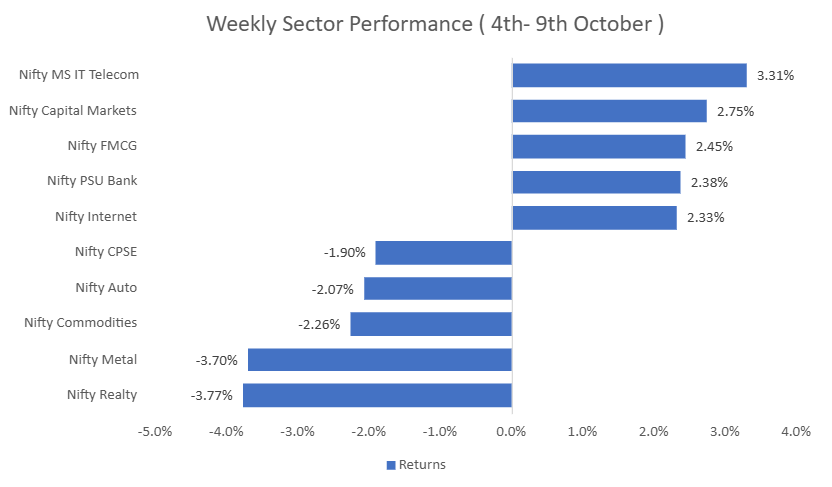
Weekly Sector Performance (4th October - 9th October)
Stocks in Focus
Nifty 500: Top Eagle stocks
In the Tradepoint and Zone web terminals, we have developed a scanner called the Eagle scanner. It considers the price setup on multiple timeframes, relative strength, matrix scores and pattern counter scores before scoring the stock.
Below are the top 15 stocks in the Nifty 500 index based on the Eagle score.
In RZone, we have developed a scanner that evaluates both P&F Price and Relative Strength (RS) charts. It allows you to combine price patterns with RS conditions to identify stocks that are showing a bullish/bearish price setup along with relative outperformance/Underperformance.
We also cover this pattern and the process of identifying such stocks in our weekly “Market Kya Lagta Hai” (MKLH) video.
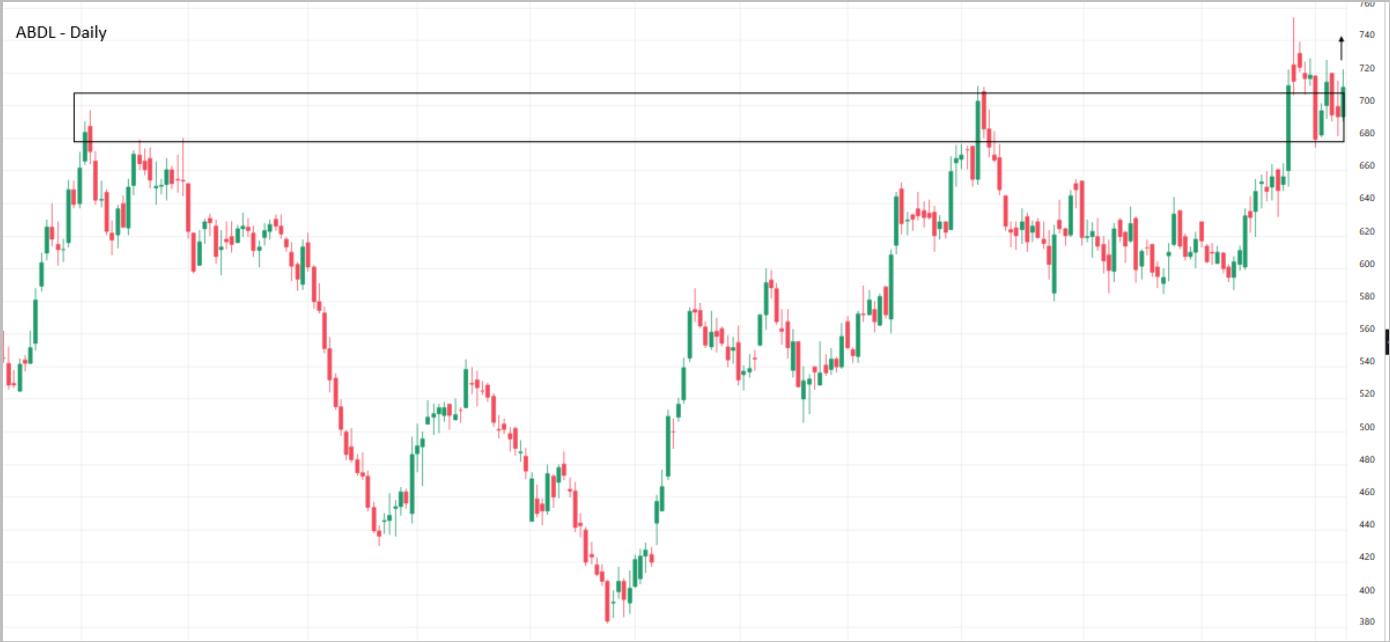
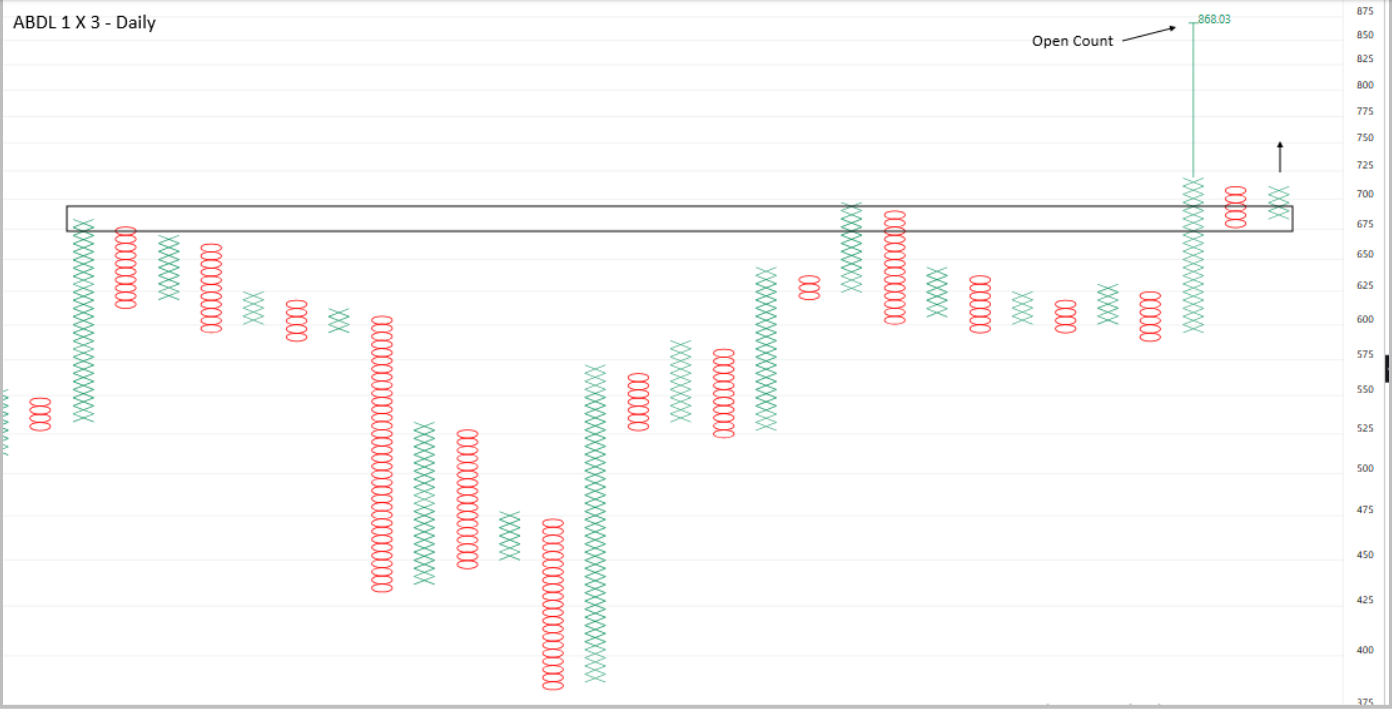
ABDL has seen a strong up move on the daily chart, rallying from the ₹380 zone to around ₹700. After this rise, the stock spent an extended period consolidating in the ₹580-₹705 range, with the ₹675-₹705 area acting as an overhead supply zone. The stock has now broken out above this supply zone with a strong move, reaching a high near ₹750. It has since pulled back to retest the ₹675 level, found support there, and is now closing near ₹708.
The Point & Figure chart (1% × 3) mirrors this structure. After the initial rally, price moved into a sideways consolidation below the ₹675-₹690 supply zone. The breakout column of X’s pushed price above this zone, followed by a pullback that held near the zone’s upper edge. The most recent column of X’s has pushed price back up to around ₹705, in line with the range breakout and retest on the daily chart. The Open Count target from this move projects an upside objective of ₹868.03. A sustained hold above the ₹675 supply zone would support continuation of the uptrend towards this ₹868 target.
CPPLUS
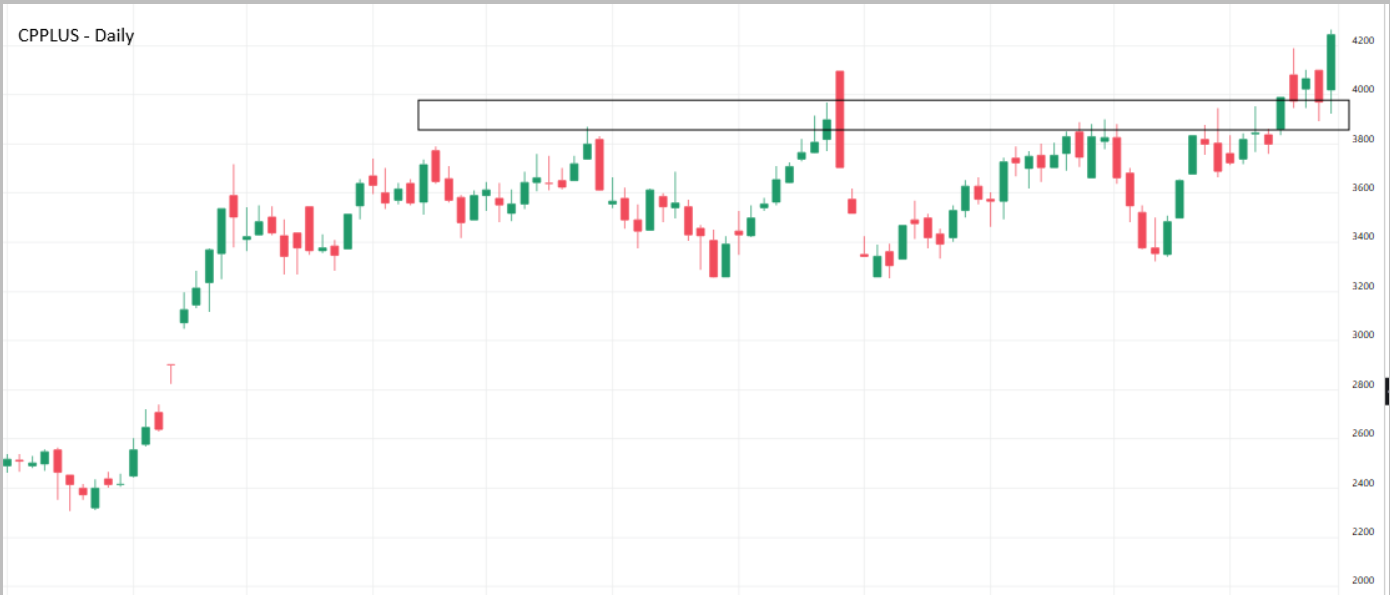
CPPLUS has witnessed a strong up move on the daily chart, rallying from the ₹2,300–₹2,500 zone to above ₹3,500. Following this rise, the stock entered an extended consolidation phase, with the ₹3,800–₹3,950 zone acting as an overhead resistance area. After multiple attempts to move above this range, the stock has now broken out decisively and is trading around ₹4,200, indicating a potential continuation of the uptrend.
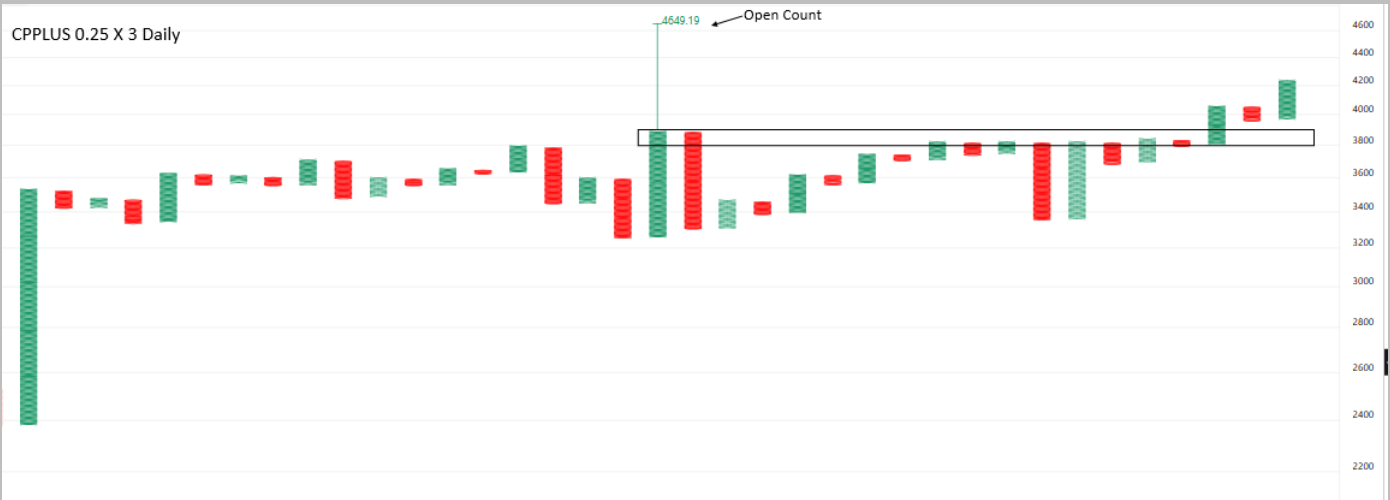
The Point & Figure chart (0.25% × 3, Daily) reflects a similar structure, with price consolidating around the ₹3,800–₹3,900 resistance zone before moving higher. The latest column of X’s has broken above this range, confirming the bullish breakout. The Open Count target projects an upside objective of ₹4,649.19. A sustained hold above the ₹3,800–₹3,900 breakout zone would support the continuation of the uptrend towards this objective.
PSU Banks: Is the next rally Coming Together
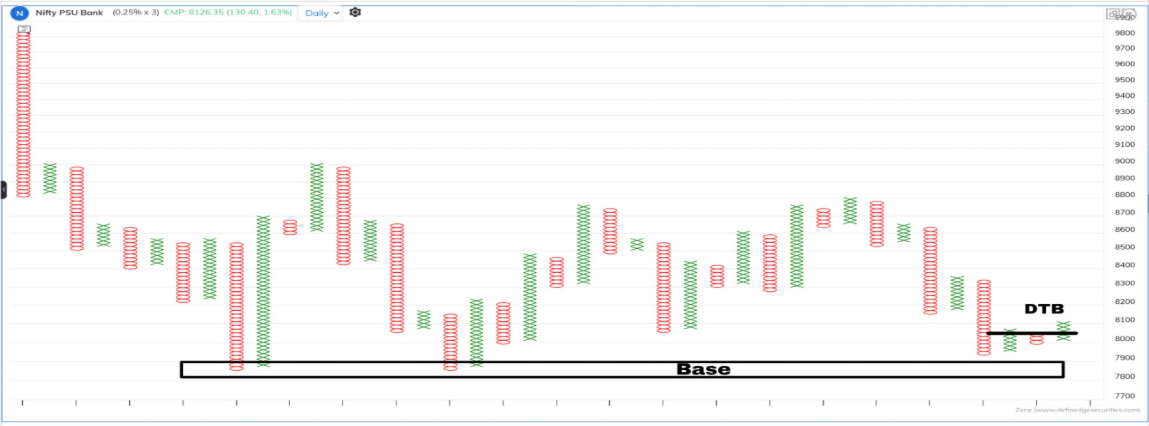
Buyers come in when the Nifty PSU Bank Index reaches 7,800-7,900 and it is called the base. What if this isn’t just another bounce, but the beginning of something bigger?
The Nifty PSU Bank Index has held its support zone several times forming a possible base on the Point & Figure (P&F) chart. Now, the story has an interesting twist with a bullish Double Top Buy (DTB) breakout near 8,000-8,050.
Why is This Breakout Important?
As the selling pressure gradually wanes and prices cease to fall appreciably, a base forms. Repeated defence of the 7,800-7,900 zone indicates buyers are coming in lower down.
The DTB’s latest breakout above a previous resistance price suggests bullish momentum is picking up steam for the index.
Two developments on the chare are noteworthy:
- Support holding: Base intact at ~7,800–7,900.
- Improving momentum: The DTB breakout indicates that buyers are trying to take the initiative.
If the index can hold the breakout and attract follow-through buying, the reversal setup could get a boost. However, a break below the base would invalidate this view.
Which PSU Banks are leading the pack?
A rising sector index doesn’t mean equal strength among its components. This is where the Ultimate P&F-RS Matrix helps identify relative-strength leaders.
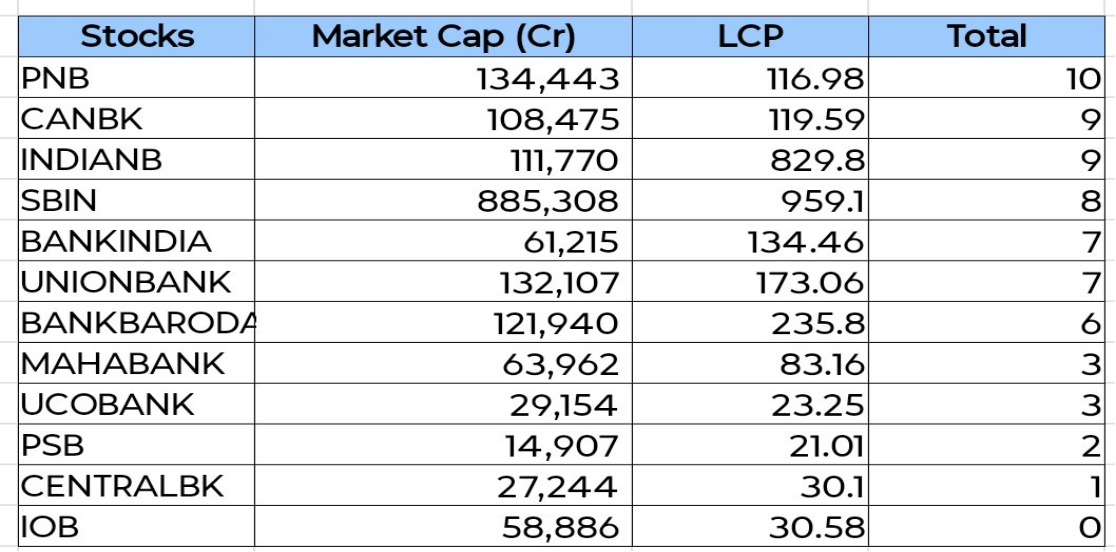
Ultimate P&F-RS Matrix rankings show relative strength within the peer group.
PNB has been ranked at 10 followed by Canara Bank and Indian Bank at 9. SBI gets 8, Bank of India, Union Bank 7.
What Traders & Investors Need to Watch
The immediate focus is on whether the index will hold its move above the 8,000-8,050 breakout zone. continued strength and improving participation across PSU banks lent cred to the reversal setup
The 7,800-7,900 area is still the key support area. A clear break below it would kill the bullish outlook The Bottom Line
The PSU banking sector has two positive trends working in its favour – a potential base formation and a bullish DTB breakout.
Traders can begin their analysis with Canara Bank and Indian Bank, which are at the top of the relative-strength rankings, followed by PNB.
FII — DII Activity
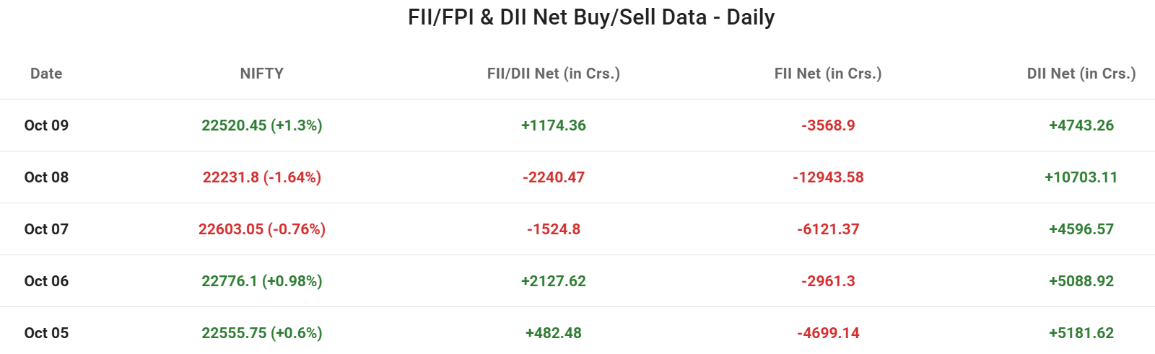
Foreign investors remained under heavy selling pressure throughout the week. FIIs sold around ₹4,699 crore on Monday, 5 Oct, followed by selling of ₹2,961 crore on Tuesday and ₹6,121 crore on Wednesday. Selling intensified on Thursday, with outflows of around ₹12,944 crore, before continuing on Friday with selling of approximately ₹3,569 crore. Overall, FIIs were net sellers of around ₹30,294 crore during the week.
Domestic institutions remained strongly supportive and consistently absorbed the selling pressure. DIIs bought around ₹5,182 crore on Monday, ₹5,089 crore on Tuesday and ₹4,597 crore on Wednesday. Their buying increased sharply on Thursday to around ₹10,703 crore, followed by purchases of ₹4,743 crore on Friday. Overall, DIIs ended the week as net buyers of around ₹30,313 crore.
Overall, FIIs remained heavy net sellers during the week, while DIIs continued their strong and consistent buying, nearly offsetting the entire foreign outflow. Nifty closed at 22,520.45 on Friday, 9 Oct, compared with 22,555.75 on Monday, 5 Oct, registering a marginal weekly decline of around 0.16%. Despite sharp selling by foreign investors, strong DII buying helped absorb the selling pressure and kept the combined institutional net flow marginally positive at around ₹19 crore.
FII, PRO & CLIENT POSITIONING – WEEKLY VIEW
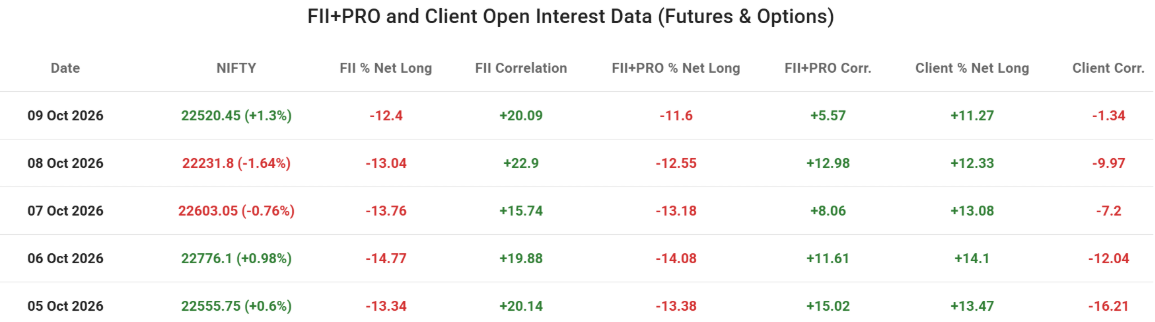
During the week, Nifty ended nearly flat but was volatile, closing at 22,520.45 on Friday, 9 Oct, compared with 22,555.75 on Monday, 5 Oct, a weekly decline of around 0.16%. The index gained on Monday (+0.6%), Tuesday (+0.98%) and Friday (+1.3%), but fell on Wednesday (-0.76%) and Thursday (-1.64%). The Thursday drop to 22,231.8 was the week's low before Friday's rebound.
FII positioning improved modestly during the week, with FII % Net Long rising from -13.34% on 5 Oct to -12.4% on 9 Oct. FIIs trimmed their net short exposure after touching the weekly low of -14.77% on 6 Oct. FII Correlation stayed almost unchanged, at +20.14% on 5 Oct and +20.09% on 9 Oct. It fell to +15.74% on 7 Oct and rose to +22.9% on 8 Oct, so the positive relationship with the index remained intact.
FII+PRO % Net Long also improved, moving from -13.38% to -11.6%, which suggests professional participants reduced their net short exposure. Their correlation with Nifty weakened sharply, falling from +15.02% to +5.57%, indicating that their positioning became far less aligned with index moves by the end of the week.
Client positioning remained positive but eased, with Client % Net Long declining from +13.47% on 5 Oct to +11.27% on 9 Oct, after peaking at +14.1% on 6 Oct. Client Correlation moved from -16.21% to -1.34%, which means the strong inverse relationship with the index nearly disappeared.
Overall, FII and FII+PRO shorts were partially covered, while clients reduced their net long exposure, so the gap between the two groups narrowed. The sharp fall in FII+PRO correlation and the near-zero client correlation suggest positioning became less directional and more balanced as Nifty ended the week almost unchanged. Net short positions among FIIs and FII+PRO still remain, so the overall stance is cautious.
Future Open Interest Buildup
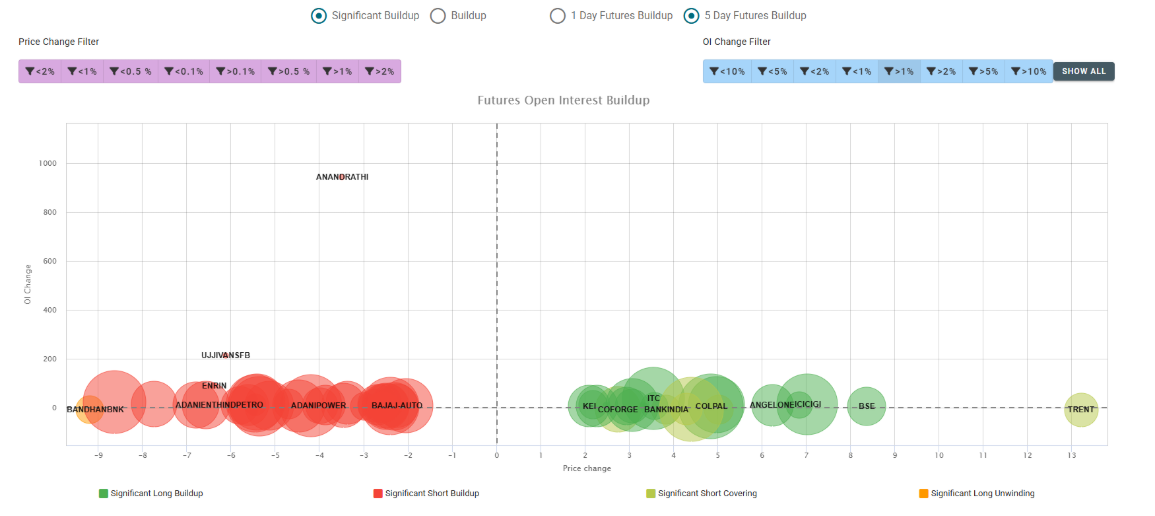
The futures market showed a mixed tone this week, with significant short buildup dominating across several stocks, while fresh long buildup and short covering were also visible in select counters.
Stocks such as Bandhan Bank, Ujjivan Small Finance Bank, Eicher Motors, Adani Enterprises, Hindustan Petroleum, Adani Power, and Bajaj Auto witnessed falling prices along with rising Open Interest, indicating fresh short positions. Anand Rathi also recorded a significant increase in Open Interest alongside a price decline.
On the positive side, KEI, Coforge, ITC, Bandhan Bank, Colgate-Palmolive, Angel One, and BSE saw rising prices and increasing Open Interest, pointing to fresh long buildup.
Meanwhile, Trent witnessed short covering, as its price rose while Open Interest declined.
The size of each bubble represents the stock's Volume Percentile, with larger bubbles highlighting stocks that witnessed unusually high futures trading activity compared with the past year.
Overall, short buildup remained a key theme, with several stocks facing price pressure. However, fresh long positions in select counters indicate pockets of strength, keeping the overall futures setup mixed.
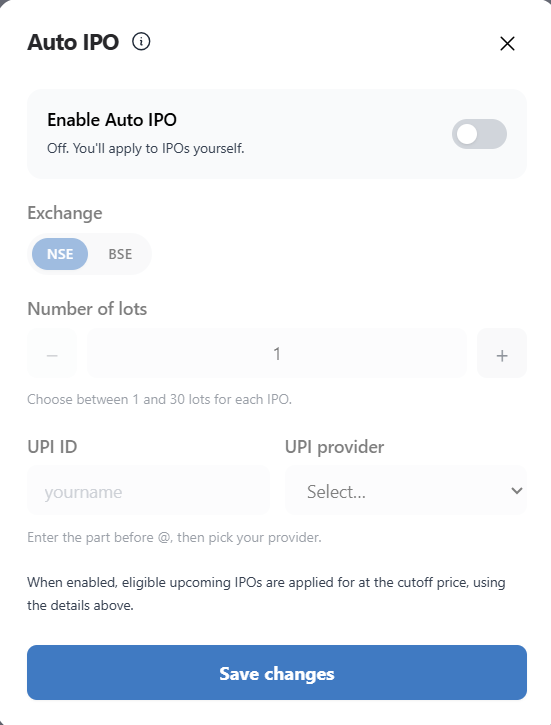
Never Miss a Mainboard IPO Again: Introducing Auto IPO
There are no IPOs open for bidding right now, so the list is empty. As soon as a new Mainboard IPO we pick opens, we’ll apply for you automatically.
An Initial Public Offering (IPO) is when a private company offers its shares to the public for the first time and lists on a stock exchange like the NSE or BSE. Companies go public to raise money for growth, pay down debt, or let early investors and promoters sell part of their stake. For investors, it’s a chance to own a business from the moment it enters the market.
Mainboard vs SME IPOsIPOs in India come in two kinds: Mainboard IPOs are issued by larger, established companies and list on the main platforms of NSE and BSE. They face stricter eligibility and disclosure rules. SME IPOs are issued by smaller companies and list on the separate SME platforms (NSE Emerge and BSE SME). They usually carry higher risk and larger minimum investments
Allotment and listing Many popular IPOs are oversubscribed, meaning far more shares are applied for than are on offer. In that case, retail allotment is decided by a lottery, and successful applicants usually receive one lot. If you don’t get an allotment, the blocked money is released. Shares are then listed on the exchange, typically within three working days of the issue closing. The difference between the issue price and the price at listing is the listing gain (or loss)Either way, there’s a practical problem. With several IPOs opening each month, it’s easy to miss one because you didn’t notice the dates, forgot to apply, or were busy when the issue closed.
Introducing Auto IPO
That’s why we built Auto IPO for Definedge Securities clients. With Auto IPO, you save your details once and we take care of the rest. In the background, we check each new Mainboard IPO and decide which ones to apply for. When one of them opens, we apply on your behalf. You just approve the payment on your UPI app.How it works 1. Switch it on. Turn on Auto IPO and save your preferences: Exchange: NSE or BSE Number of lots: anywhere from 1 to 30 per IPO UPI ID: for the payment mandate 2. We apply for you. When an eligible Mainboard IPO opens, we place the application using your saved details, at the cutoff price. 3. You approve. You’ll receive a UPI mandate request. Approve it to complete your application.Applications are submitted by us on the last day of the issue, on a first-come, first-served basis, so make sure you approve your UPI mandate promptly.
Where to find it 1. Log in and open the Dashboard. 2. Click the apps menu (the grid icon in the top bar) and select IPO. 3. On the Primary Market page, you’ll see the Auto IPO button at the top right. It shows OFF by default. Click it to turn it on and save your preferences.4. You can track your applications any time under the Applied tab, right beside it. Turn on Auto IPO today and let your IPO investing run on Autopilot. IPO investments are subject to market risks. Applying does not guarantee allotment, and listing gains are not assured. Please read the offer document carefully before investing
A Case for Large Caps
Lage cap stocks have taken a big hit in the recent months while the small and microcap stocks managed to display relative outperformance. Just for some context, the Nifty 50 index fell 6% in September and the Nifty 100 index dropped 5.9%. In contrast, the Nifty Smallcap 500 index fell just 2.5% while the Microcap 250 index lost just 1%.
The question now is whether the large cap stocks can stage some comeback after the recent rout. We think so and this is based on the following observations.
Oversold breadth
Ratio chart at inflexion point
Nifty 100 index at key support zone
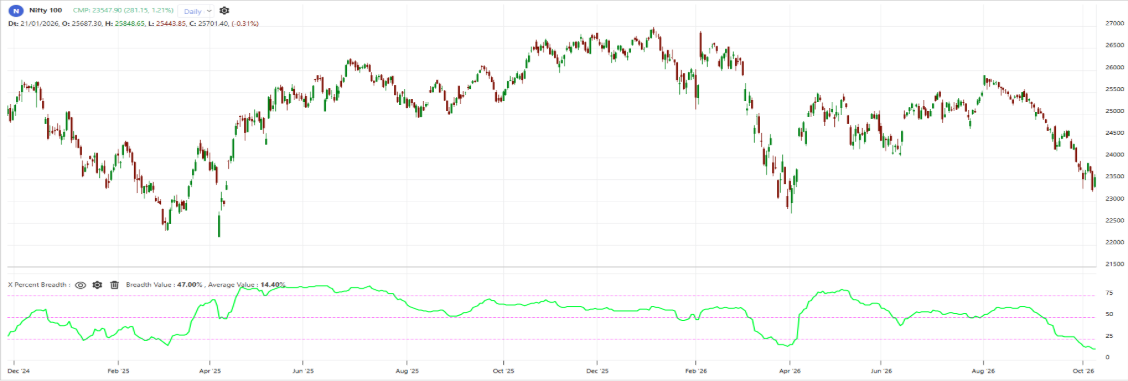
Let us examine each of these factors. Have a look at the PF-X% breadth indicator of the Nifty 100 universe plotted in the chart below. The breadth indicator is plotted using the 3% box size which captures the long-term breadth.
It is apparent from the above chart that the breadth indicator is in oversold zone at 13%. Considering the oversold breadth reading in the long-term charts, there is a possibility of a rebound or recovery from these levels.
There has been a meaningful bounce in this index when the breadth indicator reached such extreme oversold zone on earlier occasions. Hence, there is a possibility of a bounce this time too. But breadth reaching oversold zone is still not a convincing enough reason, one might argue.
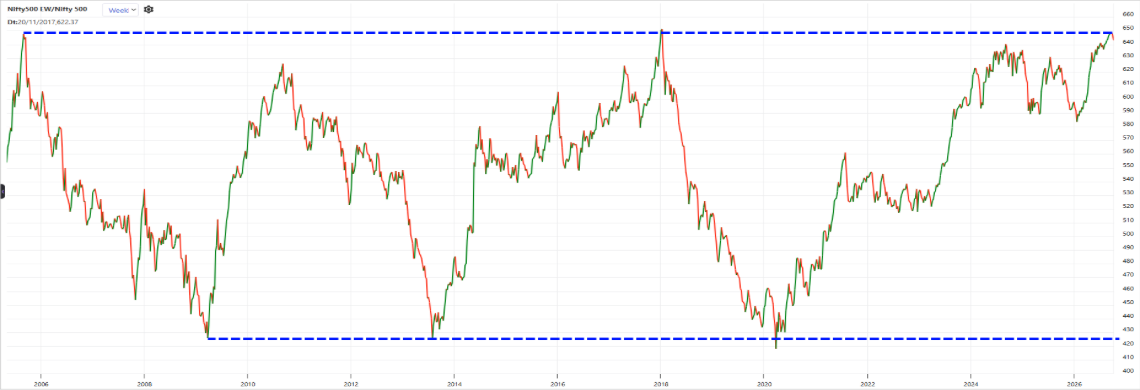
Let us look at the next factor in favour of large cap stocks. Here is the ratio chart of Nifty 500 Equal Weight Index versus Nifty 500 index which is free float market cap weighted index.
The weekly ratio chart featured above captures the ratio chart of the equal weighted index versus the market cap weighted one. Notice how major turning points in the market have been captured by this ratio chart.
The ratio chart has turned lower from a key resistance zone. This means the broader markets might underperform. The operative phrase here is “might”. This is not conclusive enough yet.
We consider a few scenarios where the broader markets can display relative underperformance.
Broader markets fall while the large cap stocks fall at a relatively slower pace
Broader market rises but at a pace which is slower than large caps
Broader markets fall while the large cap stocks stage a recovery
Out of these three scenarios, scenario number 1 is the worst possible outcome. The other two are more manageable from a trading or investment perspective. But the first scenario is not likely because of the oversold long-term breadth.
We believe that scenario number 2 listed above is the most likely outcome primarily based on the long-term breadth indicator being oversold. The third scenario is also a possibility which again means that large cap stocks could do relatively better going forward.
Let us also consider the third reason which strengthens the case for expecting scenario the first scenario to play out.
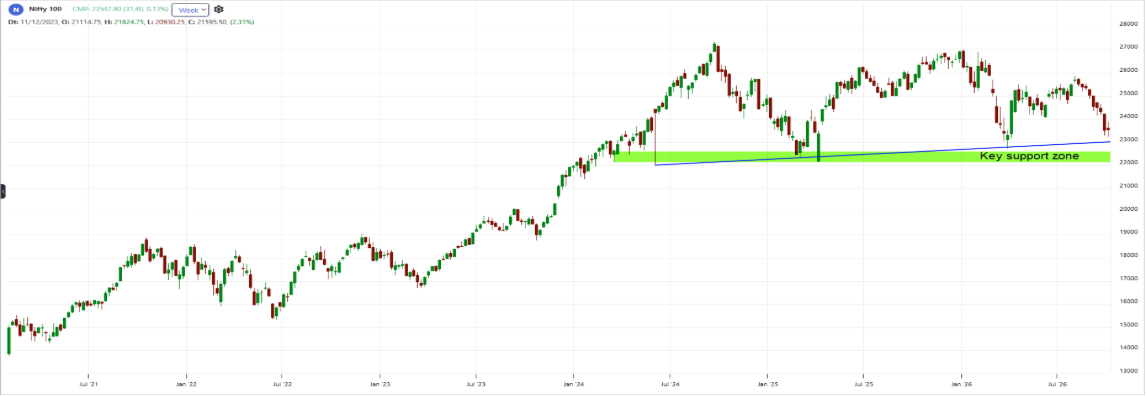
Have a look at the price chart of the Nifty 100 index featured below.
The price is at crucial trendline support and just a touch above the horizontal green support zone highlighted in the chart above. There is a possibility that prices can stabilize and stage a recovery from these levels.
Hope stringing of these three factors makes a convincing case to expect some rebound in the large cap universe. As always, await confirmation and focus on risk management and position sizing.