

17th October 2026 Weekly Newsletter

Market Overview

NIFTY50 SHORT TERM VIEW
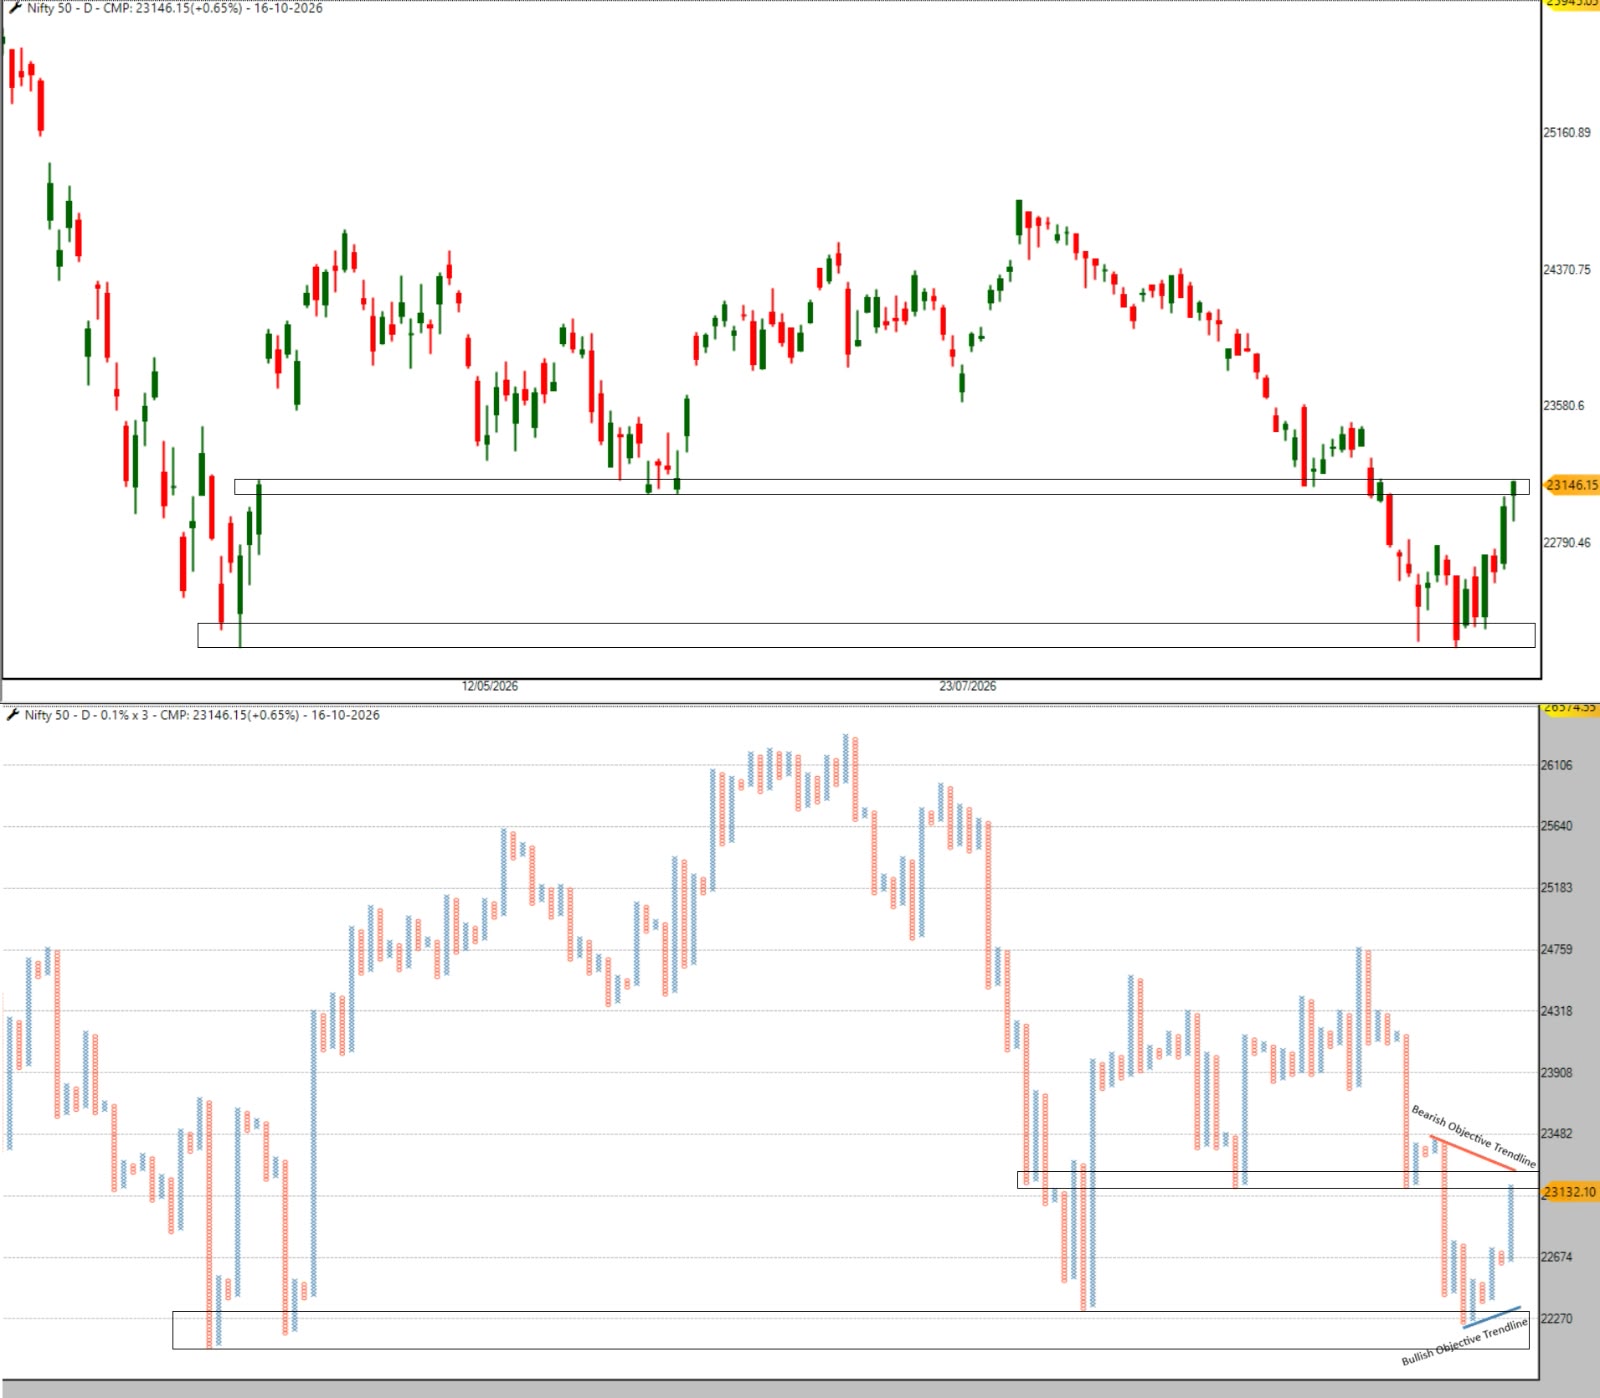
Large-cap stocks had been out of favour for quite some time, but this week they made a strong comeback. The Nifty 50 outperformed both the mid-cap and small-cap indices, with 37 out of 50 Nifty stocks delivering positive returns. 

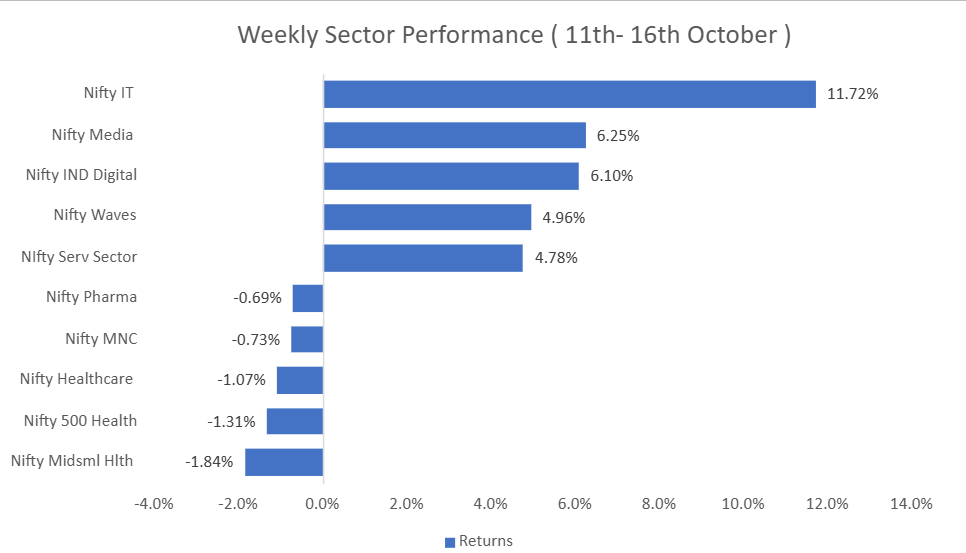
The biggest contribution came from IT stocks. The Nifty IT index jumped 11.72% in just one week, marking its strongest weekly performance in 18 years. Among the Nifty 50 IT stocks, Tech Mahindra gained 18.22%, followed by TCS (14.33%), Infosys (13.46%) and HCL Tech (13.42%). This strong rally helped the Nifty close nearly 3% higher for the week and move back above its 200-week moving average. 

In our last newsletter, we highlighted 22,150–22,300 as an important support zone for the Nifty and mentioned that the index could recover if it managed to hold above this zone. That is exactly what happened. The Nifty held this support and bounced back strongly. We also mentioned that a move above 22,800 could take the index towards 23,000–23,050, and those levels were achieved as well. 

After this strong recovery, the Nifty is now approaching an important resistance area. The Bearish Objective Trendline is placed near 23,250, and there is also an unfilled gap from 24 September 2026, when the Nifty opened sharply lower. For the rally to continue, the Nifty needs to close above the 23,250–23,350 zone. A sustained move above this area could open the door for further upside. 

Levels to Watch 

  • Immediate Resistance: 23,050–23,150 

  • Above 23,150: Opens upside towards 23,250–23,350 

  • Immediate Support: 22,700–22,800 

Important Note: Three major banking stocks in the Nifty 50 HDFC Bank, ICICI Bank and Axis Bank are scheduled to announce their quarterly results on Saturday, 17 October 2026. Together, these stocks account for approximately 22.6% of the Nifty 50, so their results could have a significant impact on the market's next move. 

Also, as Tuesday is a market holiday, the weekly expiry will take place on Monday. 

BANKNIFTY SHORT TERM VIEW
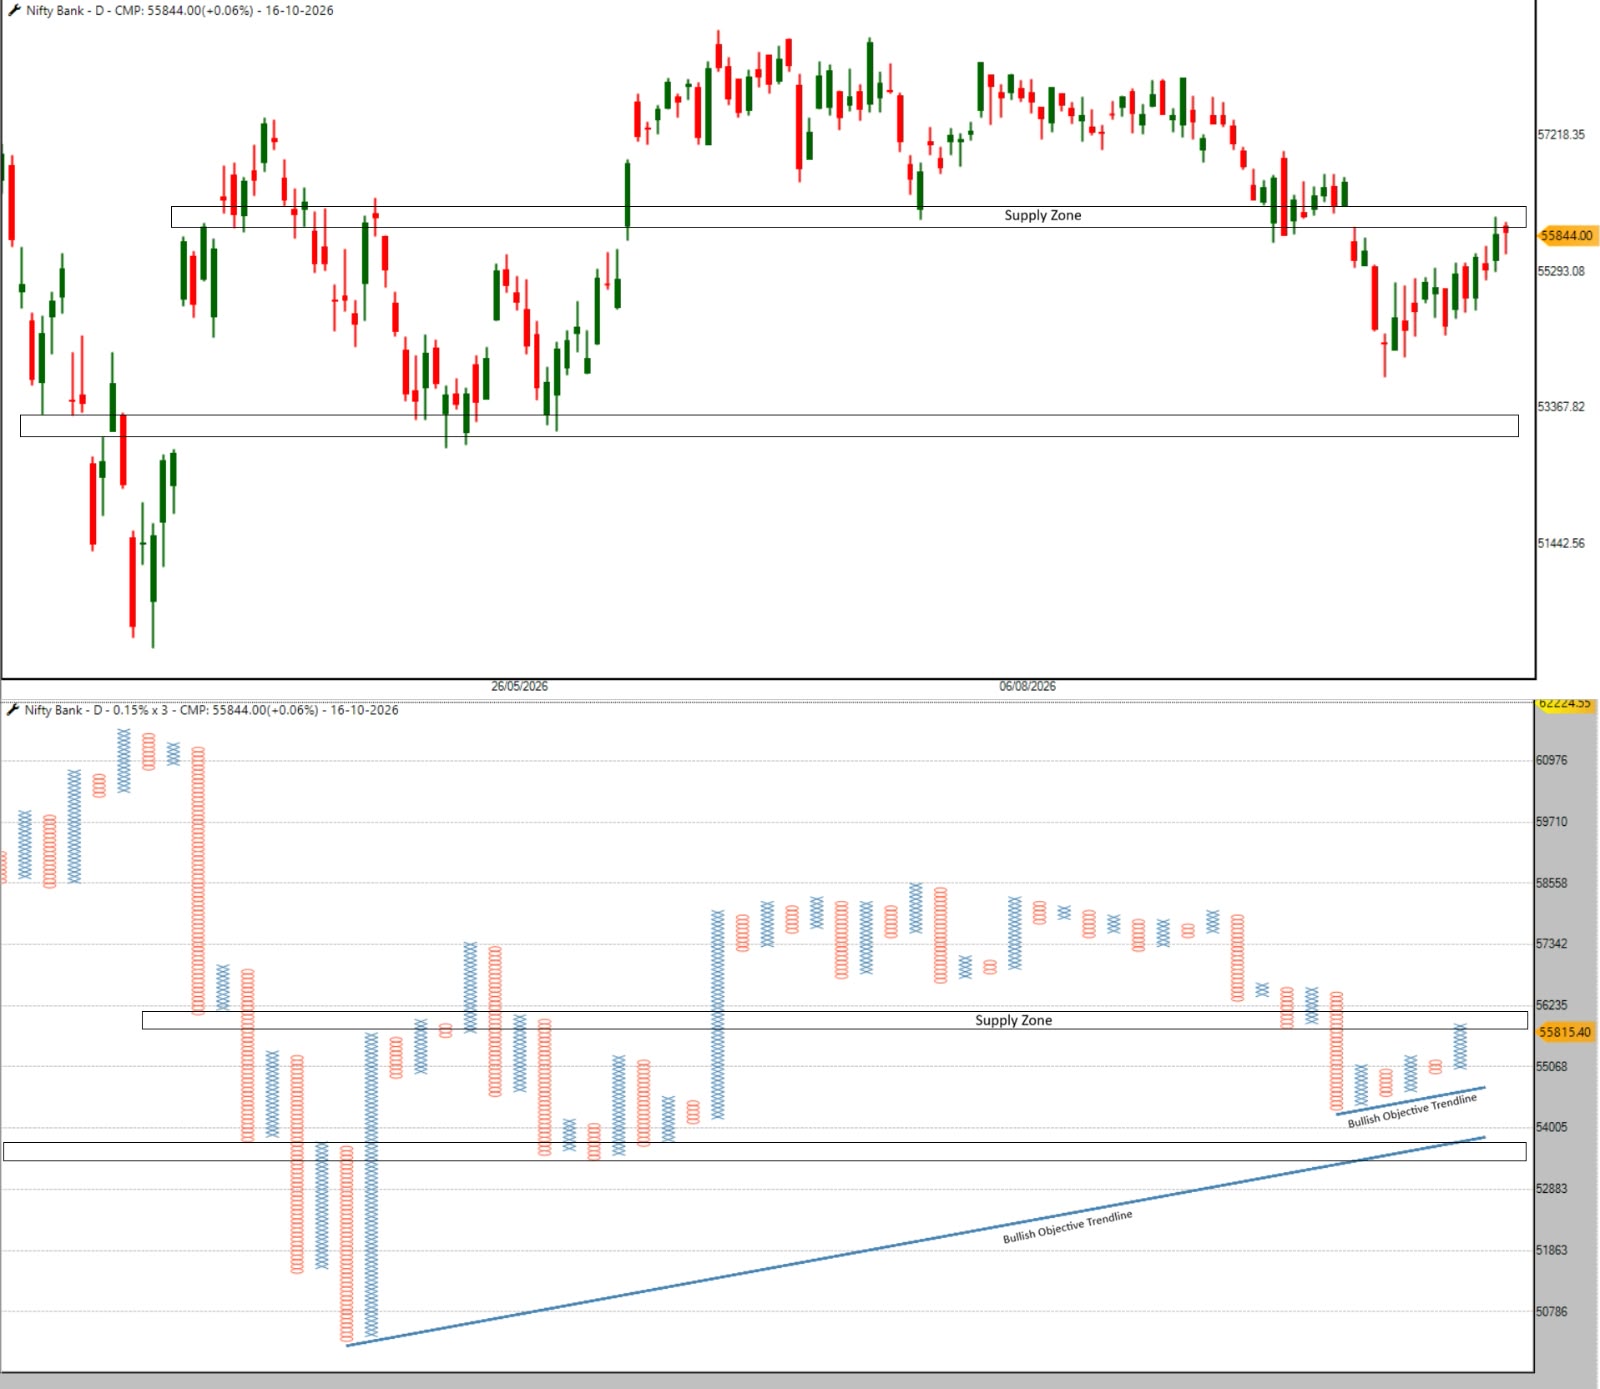
Saturday could play an important role in deciding Bank Nifty's direction on Monday. Three major banking stocks HDFC Bank, ICICI Bank and Axis Bank will announce their quarterly results on Saturday, 17 October 2026. Together, these stocks account for approximately 67% of Bank Nifty. Their results could have a significant impact on the index when the market opens on Monday. 

This week, Bank Nifty underperformed the Nifty 50 and is now trading near an important resistance zone. There is also an unfilled gap from 24 September 2026, when Bank Nifty opened sharply lower. For the recovery to continue, Bank Nifty needs to close above 56,200. A move above this level could indicate further strength. 

On the downside, holding above the Bullish Objective Trendline will be important. If Bank Nifty breaks below this trendline, the next important support area is placed around 53,500–53,700, where another Bullish Objective Trendline is also present. This makes the zone an important area to watch for buying support. 

Levels to Watch 

  • Immediate Resistance: 55,950–56,200 

  • Immediate Support: 54,000–54,500 
Market Breadth

NIFTY 500 MARKET BREADTH 

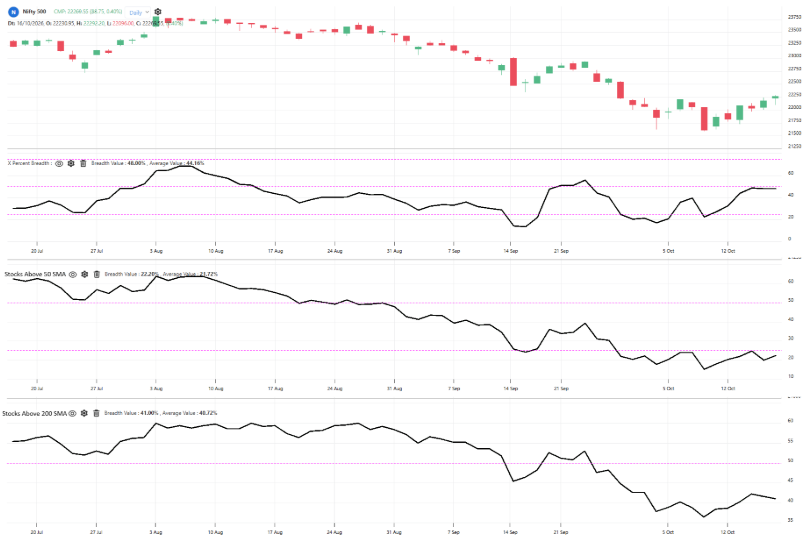
P&F X% Breadth 

The P&F X% Breadth Indicator is currently at 48.00%, with around 240 stocks in the X column. It has improved sharply from 26.80% last week and has moved out of the oversold zone, indicating a good recovery in short-term market breadth. 

Stocks Above 50-Day Moving Average 

The Stocks Above 50-Day Moving Average indicator is currently at 22.20%, with around 111 stocks trading above their 50-day moving average. It has improved slightly from 18.00% last week but remains in the oversold zone, showing that medium-term market participation is still weak. 

Stocks Above 200-Day Moving Average 

The Stocks Above 200-Day Moving Average indicator is currently at 41.00%, with around 205 stocks trading above their 200-day moving average. It has improved from 36.80% last week but remains below the 50% level, indicating that long-term market participation is recovering but is still weak. 

Overall 

Overall, market breadth has improved across all three indicators compared to the previous week. P&F X% Breadth has shown a strong recovery, while the 50-Day and 200-Day Moving Average breadth indicators have also improved but remain weak. This shows that market participation is recovering, although the improvement is not yet broad-based across all time periods. 

RELATIVE STRENGTH OF MAJOR ASSET CLASSES:

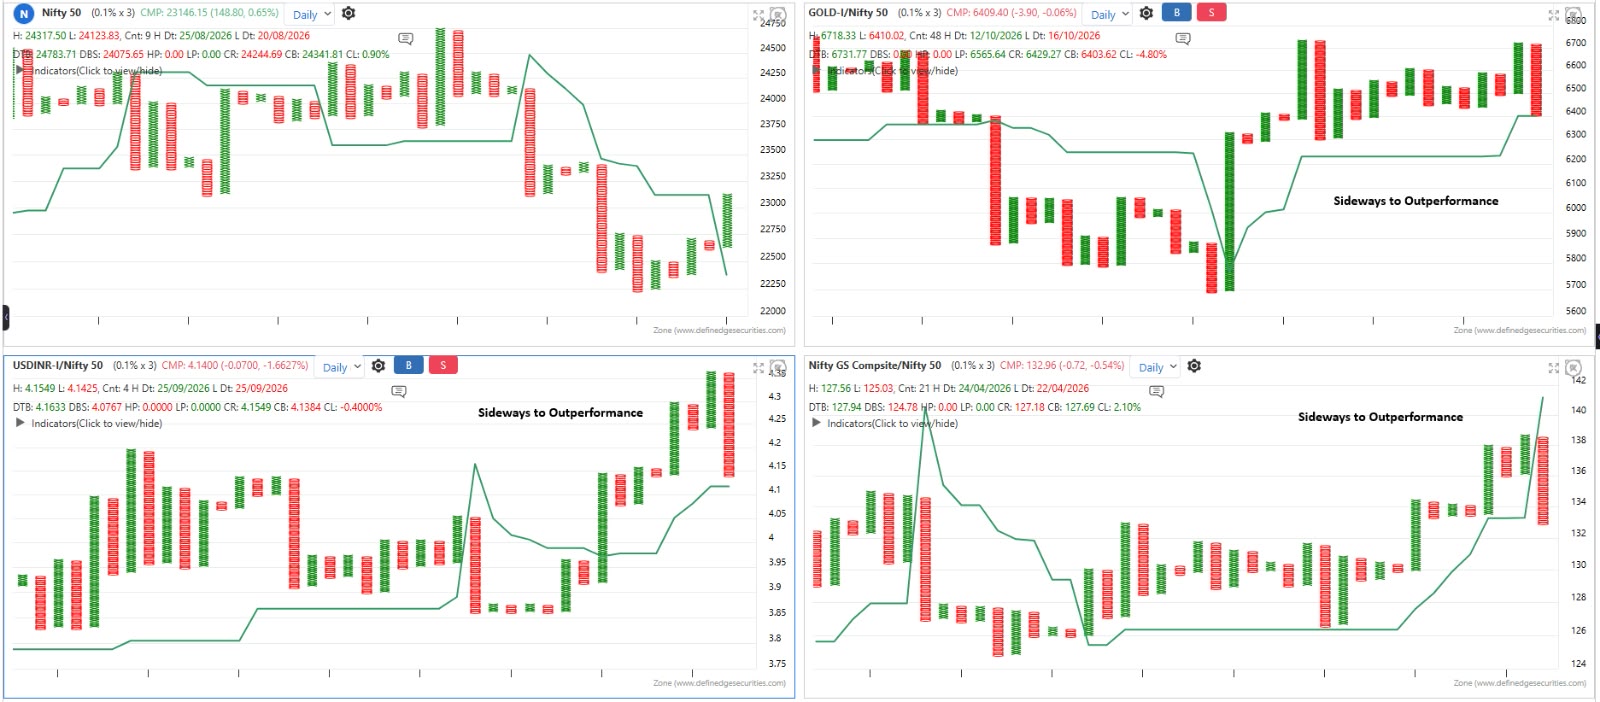
Nifty 50 (Top-Left Chart) 

The Nifty 50 has turned positive in the current column and has closed above the D-Smart line after a long period of consolidation and downtrend. A follow-through above the recent column would further strengthen the setup and could turn the trend bullish. The Nifty 50 X% Breadth has also recovered to 56% from the extreme oversold zone, indicating an improvement in market breadth. 

Gold vs Nifty 50 (Top-Right Chart) 

The RS chart is currently in a column of O's, indicating that Gold is underperforming Nifty 50 in the short term. However, the ratio is still trading above the D-Smart line. If the RS chart breaks below the D-Smart line, it would be a positive sign for the equity market, suggesting improving relative strength in Nifty 50. On the other hand, if the ratio manages to hold above the D-Smart line, we may see a positive bounce in the RS chart, indicating renewed outperformance by Gold 

USDINR vs Nifty 50 (Bottom-Left Chart) 

The RS chart has recently reversed into a column of O's after a strong upward move, indicating short-term underperformance by USDINR against Nifty 50. However, the ratio continues to trade above the D-Smart line. If the ratio breaks below the D-Smart line, it would indicate improving relative strength in equities. On the other hand, if it holds above the D-Smart line, we may see another upward move in the RS chart, suggesting renewed outperformance by USDINR. 

Nifty G-Sec Composite vs Nifty 50 (Bottom-Right Chart) 

The RS chart is currently in a column of O's, indicating that government bonds are underperforming Nifty 50 in the short term. However, the ratio remains above the D-Smart line. A break below the D-Smart line would be a positive sign for equities, indicating a possible shift in relative strength from bonds towards Nifty 50. If the ratio holds above the D-Smart line, we may see a positive bounce, suggesting that bonds could regain their relative strength against equities.

RELATIVE STRENGTH OF BROADER MARKET INDICES

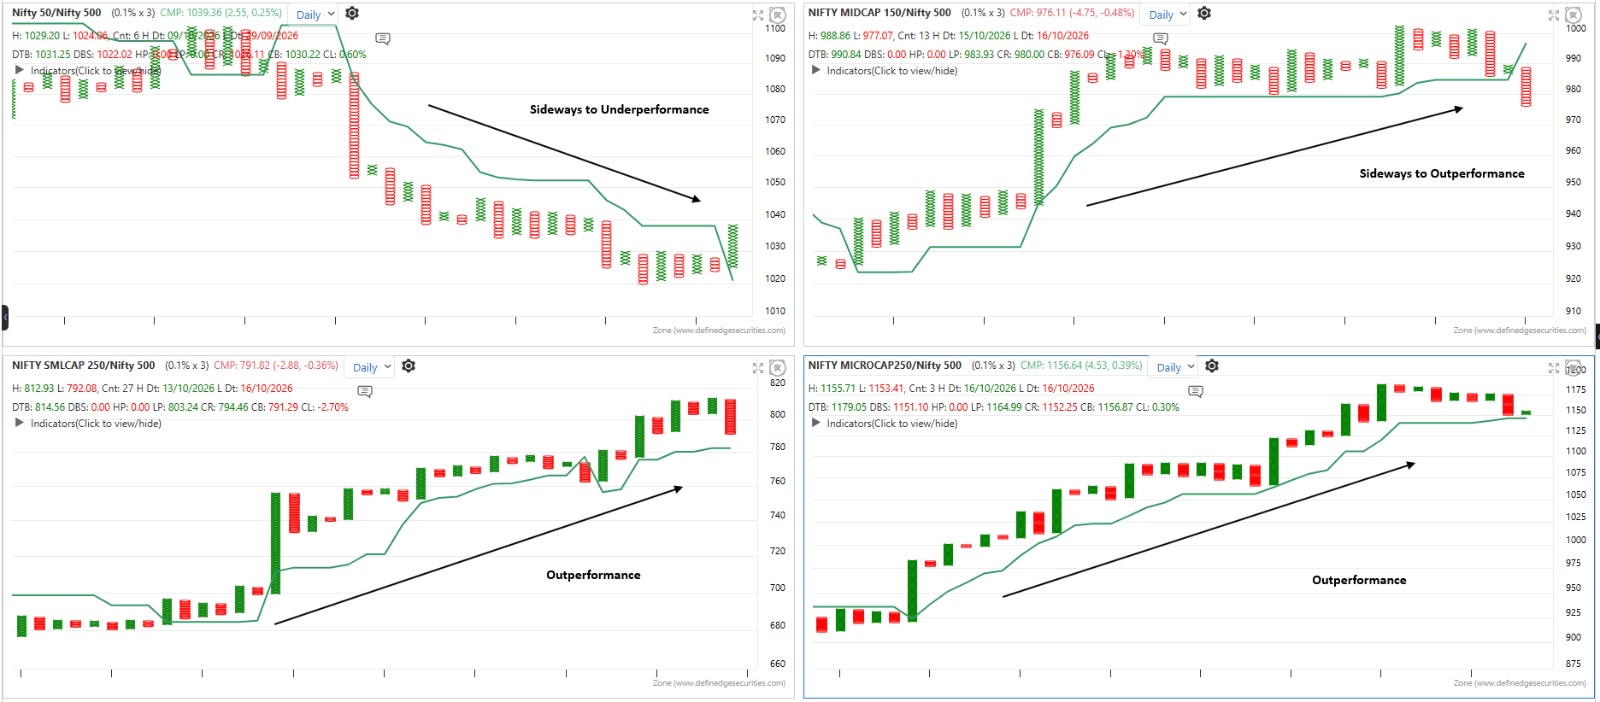
Nifty 50 / Nifty 500 (Top-Left Chart) 

The RS chart of Nifty 50 vs Nifty 500 has improved and has closed above the D-Smart line after a period of consolidation. A follow-through above the recent column would further strengthen the setup and indicate improving relative strength in Nifty 50 against the broader market. 

Nifty Midcap 150 / Nifty 500 (Top-Right Chart) 

The Nifty Midcap 150 vs Nifty 500 RS chart has closed below the D-Smart line after consolidating above it for a long time. This indicates that Midcap stocks are losing relative strength compared to the Nifty 500. Further weakness below the recent column would make the setup weaker. 

Nifty Smallcap 250 / Nifty 500 (Bottom-Left Chart) 

The Nifty Smallcap 250 vs Nifty 500 ratio continues to show outperformance and remains above the D-Smart line. However, after a sustained period of strength, the ratio has started consolidating, while its relative strength remains positive. 

Nifty Microcap 250 / Nifty 500 (Bottom-Right Chart) 

The Nifty Microcap 250 vs Nifty 500 RS chart continues to remain in an outperformance phase. The ratio is consolidating near the D-Smart line, which is acting as support. A sustained move above the recent highs would help maintain its relative strength. 

Overall, the relative-strength setup is showing a mixed picture. Nifty 50 has improved and closed above the D-Smart line, while Midcap has weakened after closing below it. Smallcap and Microcap continue to outperform the Nifty 500, but both segments are currently consolidating after their earlier strength. 

Sectors On Radar

DEFINEDGE MOMENTUM AND PERFORMANCE CHART

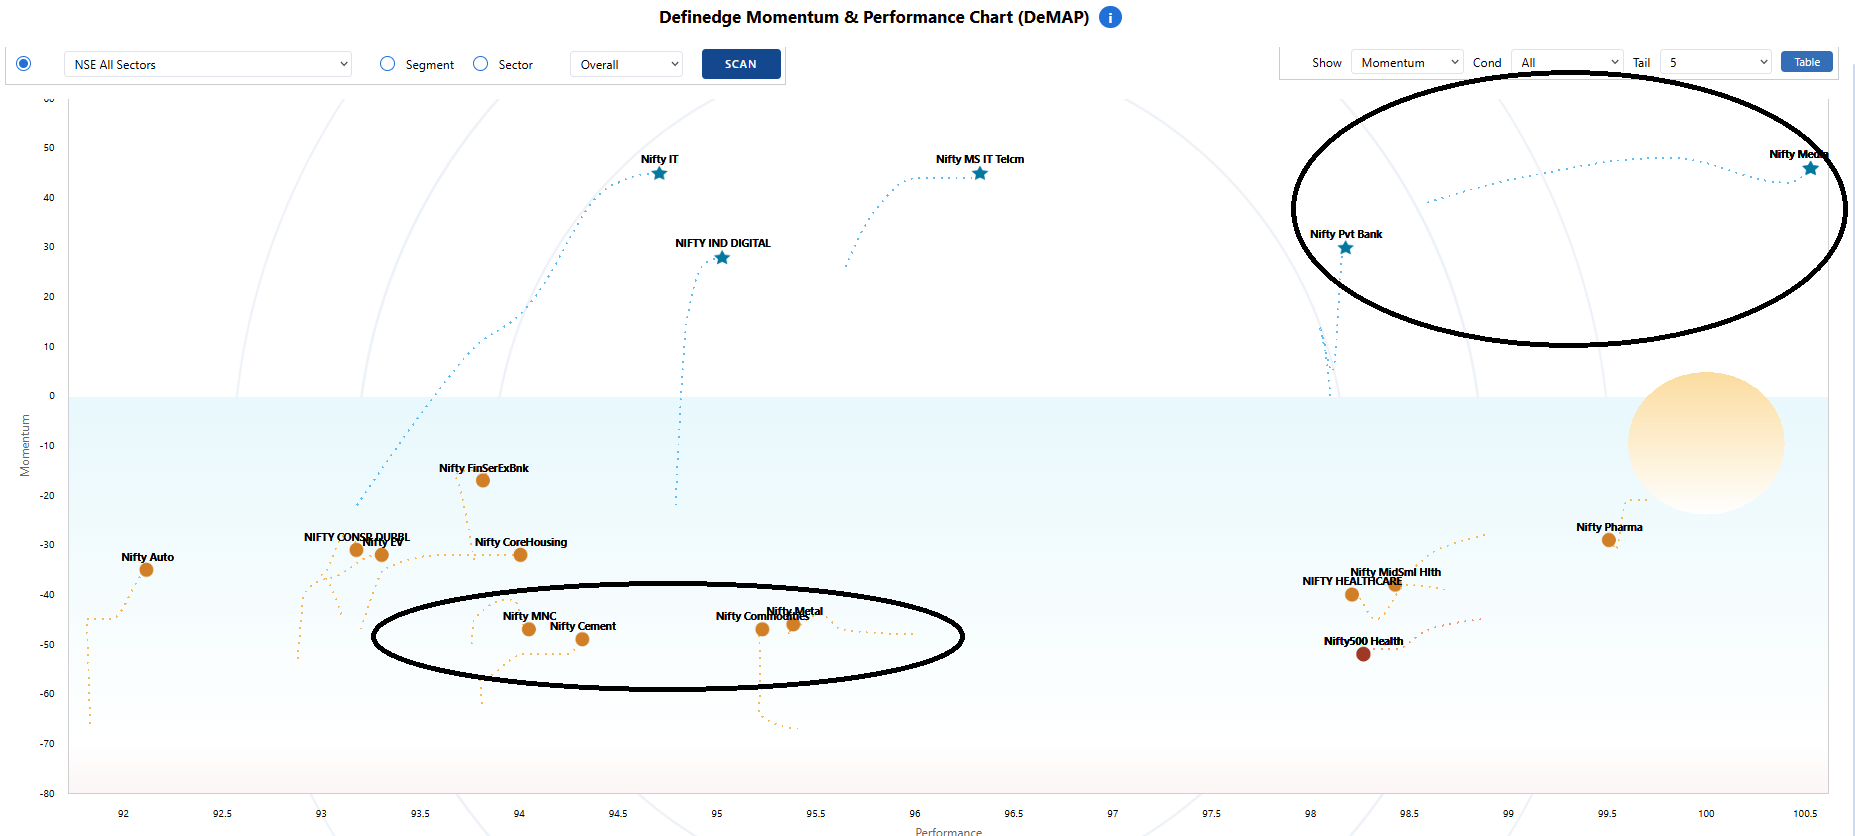
Definedge Momentum and Performance (DeMAP) is a unique study developed by Definedge that helps you analyse the market at a glance. It combines price analysis, momentum, trend-following indicators, oscillators, Relative Strength,

Dynamic Relative Strength and other popular market factors to calculate Momentum and Performance levels.

DeMAP is divided into two zones, Sky and Water. Stocks above the zero line are in the Sky and shown as Stars, while those below are in the Water and shown as Circles. Green Stars indicate strong bullish momentum, Blue Stars semibullish, Red Circles bearish and Orange Circles semi-bearish.

The circle in each chart acts like a Sun, with its position indicating the sector's stance left for bullish, middle for neutral

and right for bearish.

DEMAP

Strong sectors : Nifty Pvt Bank, Nifty Media

Weak sectors : Nifty Core Housing, Nifty RailwaysPSU, Nifty IT, Nifty EV, Nifty Auto , Nifty Metal

Weekly Sector Performance (11th October - 16th October)

Stocks in Focus

Nifty 500: Top Eagle stocks

In the Tradepoint and Zone web terminals, we have developed a scanner called the Eagle scanner. It considers the price setup on multiple timeframes, relative strength, matrix scores and pattern counter scores before scoring the stock.

Below are the top 15 stocks in the Nifty 500 index based on the Eagle score.

Sr.No 

Scrip 

Egale Score 

OHLC Pattern 

PF Pattern 

1 

SHYAMMETL 

24 

 Above 200 DMA, ADX Bullish Crossover,Bullish ADX setup, Bullish Today, Ichimoku - Bullish Setup, Ichimoku -Bullish,MACD bullish crossove 

100% Pole - Bullish; 100% Pole Follow Through - Bullish; Bear Trap; Broadening Pattern - Bullish; Double Broadening - Bullish; Low Pole; Low Pole Follow Through - Bullish; Turtle Follow-Through Bullish 

2 

TECHM 

24 

 Above 200 DMA, Bullish Today,MACD bullish crossover, RSI above 70,Volume Greater than 20-day average 

100% Pole - Bullish; Bear Trap; Low Pole; Multi-column Engulfing Bullish; Turtle Breakout - Bullish 

3 

ABDL 

23 

Above 200 DMA, Bullish ADX setup, Bullish Today,RSI above 60, , Strong ADX (Strong trend), 

4-column triangle breakout - Bullish; Bullish AFT; Bullish AFT Anchor breakout; Triangle Breakout - Bullish; Turtle Breakout - Bullish 

4 

INDHOTEL 

22 

Above 200 DMA, Bullish Today, Donchian Channel (20) Bullish Breakout, MACD bullish crossover, RSI above 60, Volume Greater than 20-day average 

Bear Trap; Broadening Pattern - Bullish; Triangle Breakout Failure - Bullish; Turtle Breakout - Bullish 

5 

CYIENT 

20 

Above 200 DMA, Bullish 3C Pullback Pattern, Bullish ADX setup, Bullish Today, Ichimoku - Bullish Setup, Ichimoku -Bullish,RSI above 60, 

123 Pullback - Bullish; Broadening Follow Through - Bullish; Double Broadening - Bullish Follow-through; Follow through -Bullish; Hidden DTB Pattern; Immediate Bullish AFT; Turtle Follow-Through Bullish 

6 

HBLENGINE 

20 

Above 200 DMA, Adaptive RSI bullish crossover, ADX Bullish Crossover,Bullish ADX setup, Bullish Today, Donchian Channel (20) Bullish Breakout,  RSI above 60,Strong ADX (Strong trend), Supertrend bullish crossover,Volume Greater than 20-day average 

Bear Trap; Multi-column Engulfing Bullish; Oops Reversal Pattern Bullish; Turtle Breakout - Bullish; Weak Breakout Bullish 

7 

PERSISTENT 

20 

Above 200 DMA, Bearish Today, Bullish ADX setup, Ichimoku -Bullish, RSI above 50, Strong ADX (Strong trend), Very Bearish Today (Index),  Volume Greater than 20-day average 

No pattern qualified 

8 

HCLTECH 

19 

Above 200 DMA, ADX Bullish Crossover, Bullish 3C Pullback Pattern, Bullish ADX setup, Bullish Today, MACD bullish crossover,  RSI above 60, Strong ADX (Strong trend),Very Bullish Today (Index),  Volume Greater than 20-day average 

100% Pole - Bullish; Bear Trap; Low Pole; Low Pole Follow Through - Bullish; Multi-column Engulfing Bullish; Turtle Breakout - Bullish; Tweezer pattern 

9 

PVRINOX 

19 

Above 200 DMA,Bullish ADX setup, Bullish Today, Donchian Channel (20) Bullish Breakout, Ichimoku - Bullish Setup, Ichimoku -Bullish, RSI above 60, RSI-252 above 50, Strong ADX (Strong trend), Very Bullish Today (Index),  

Affordable Bullish Pullback 

10 

FSL 

18 

 Above 200 DMA, Bullish ADX setup, Bullish Today, RSI above 50, RSI-252 above 50, Strong ADX (Strong trend) 

No pattern qualified 

11 

LTTS 

18 

 Above 200 DMA, Bullish 3C Pullback Pattern, Bullish ADX setup, Bullish Today, Ichimoku - Bullish Setup, Ichimoku -Bullish, RSI above 60, RSI above 70, Strong ADX (Strong trend), Very Bullish Today (Index), Volume Greater than 20-day average 

100% Pole - Bullish; Bear Trap; Bullish AFT; Bullish AFT Anchor breakout; Low Pole; Triangle Breakout Failure - Bullish; Turtle Breakout - Bullish; Tweezer pattern 

12 

PNBHOUSING 

18 

Above 200 DMA, Bearish Today, Ichimoku - Bullish Setup, Ichimoku -Bullish,  RSI above 50, 

No pattern qualified 

13 

BALRAMCHIN 

17 

Above 200 DMA, Bearish Today, Bullish ADX setup, Ichimoku - Bullish Setup, Ichimoku -Bullish,RSI above 50,Strong ADX (Strong trend), Very Bearish Today (Index) 

No pattern qualified 

14 

CUPID 

17 

Above 200 DMA, Bullish ADX setup, Bullish Today, Ichimoku - Bullish Setup, Ichimoku -Bullish,RSI above 70, RSI-252 above 50, Strong ADX (Strong trend), Very Bullish Today (Index), 

No pattern qualified 

15 

INFY 

17 

 Above 20-EMA,Bullish 3C Pullback Pattern, Bullish Today, Ichimoku - Bullish Setup, Ichimoku -Bullish, MACD bullish crossover,   

Bear Trap; Broadening Pattern - Bullish; Double Broadening - Bullish; Multi-column Engulfing Bullish; Oops Reversal Pattern  

Stocks on Watchlist

In RZone, we have developed a scanner that evaluates both P&F Price and Relative Strength (RS) charts. It allows you to combine price patterns with RS conditions to identify stocks that are showing a bullish/bearish price setup along with relative outperformance/Underperformance.

We also cover this pattern and the process of identifying such stocks in our weekly “Market Kya Lagta Hai” (MKLH) video.

Watch our weekly MKLH videos: Definedge - YouTube

BULLISH

Scrip 

Sector 

Segment 

Market Cap (Cr) 

LCP 

APOLLO 

Defence 

Nifty Microcap 250 

15435 

432 

CEIGALL 

Engineering - Construction 

Nifty Others 

6831 

392.15 

HBLENGINE 

Batteries 

SmallCap 250 

23059 

831.9 

INDHOTEL 

Hotels 

Nifty Next 50 Index 

109903 

772.1 

JUSTDIAL 

Trading 

Nifty Microcap 250 

6061 

712.7 

PCJEWELLER 

Diamond - Jewellery 

Nifty Microcap 250 

14010 

16.2 

SGMART 

Trading 

Nifty Others 

10142 

804.95 

TIPSMUSIC 

Media 

Nifty Microcap 250 

9600 

751 

BEARISH

Scrip 

Sector 

Segment 

Market Cap (Cr) 

LCP 

DMART 

Retail 

Nifty Next 50 Index 

217884 

3342 

IDFCFIRSTB 

Banks 

Midcap 150 Index 

67162 

78.08 

INDIGO 

Travel 

Nifty 50 Index 

181201 

4686.9 

LTF 

Finance - Housing - NBFC 

Midcap 150 Index 

63573 

253.85 

MCX 

Finance - Stock Broking 

Midcap 150 Index 

80628 

3162 

PAGEIND 

Textile 

Midcap 150 Index 

40315 

36145 

Stocks For The Week

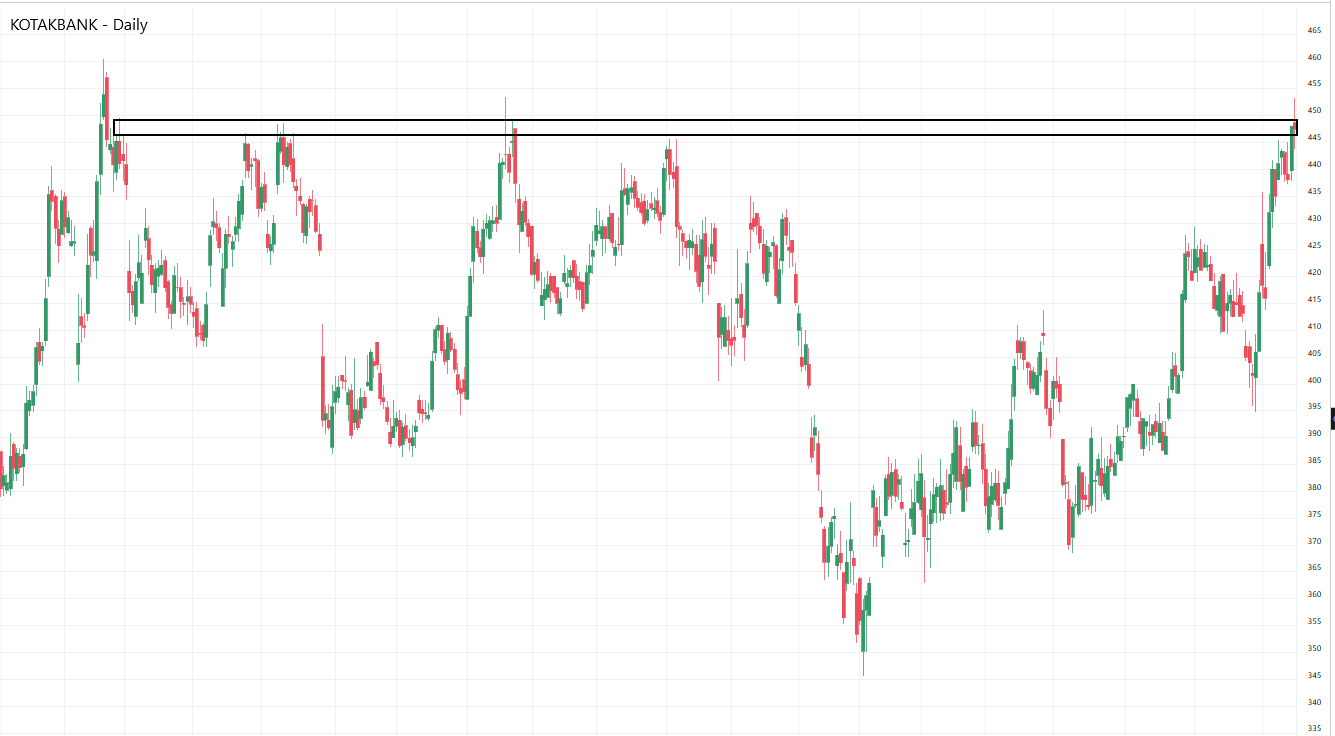
KOTAKBANK 

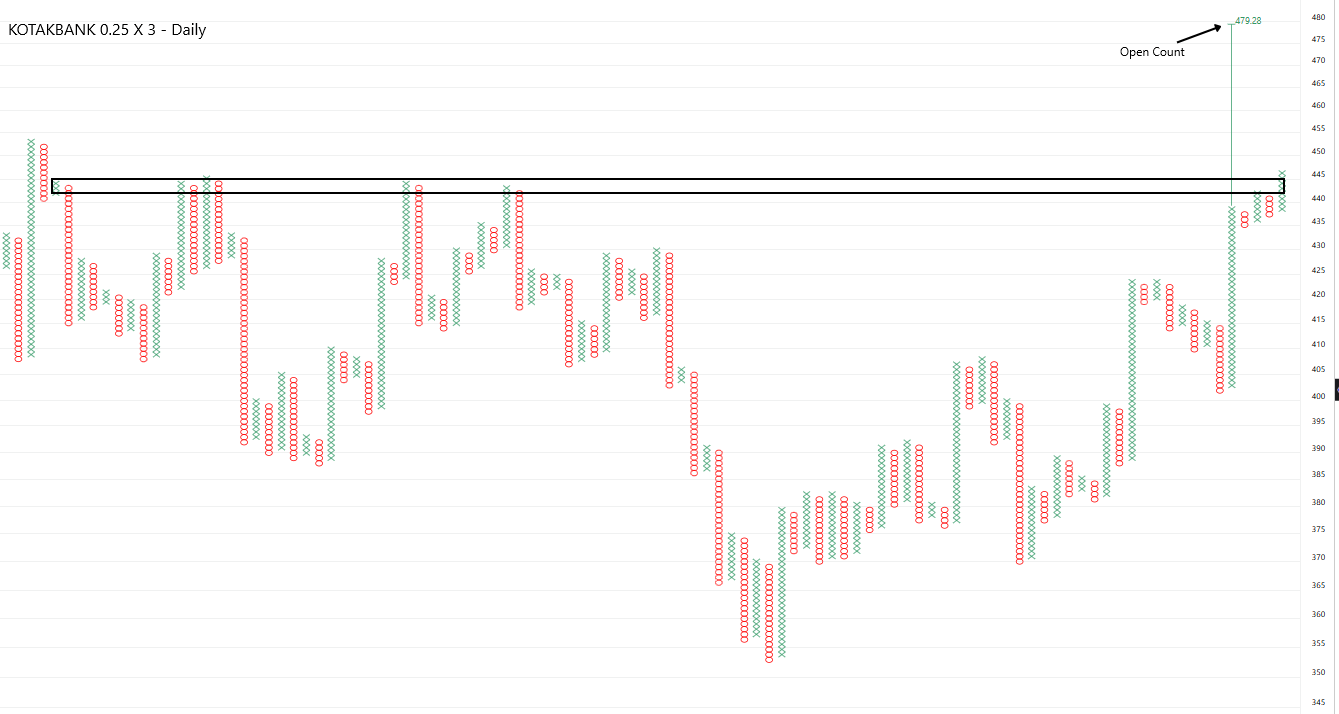
KOTAKBANK has been facing strong resistance in the 445–448 zone for several months on the daily chart. After falling to 345, the stock gradually recovered, forming a series of higher lows. It has now moved above this resistance zone, touching 452, and is currently trading near 447. 

The Point & Figure chart (0.25% × 3) also shows a similar setup. Earlier, multiple columns of X's faced resistance around 441–445. The latest column of X's has broken above this zone, indicating improving bullish momentum. The Open Count projects a potential upside target of 479. As long as the stock holds above the 441–448 zone, the chances of moving towards this target remain positive. 

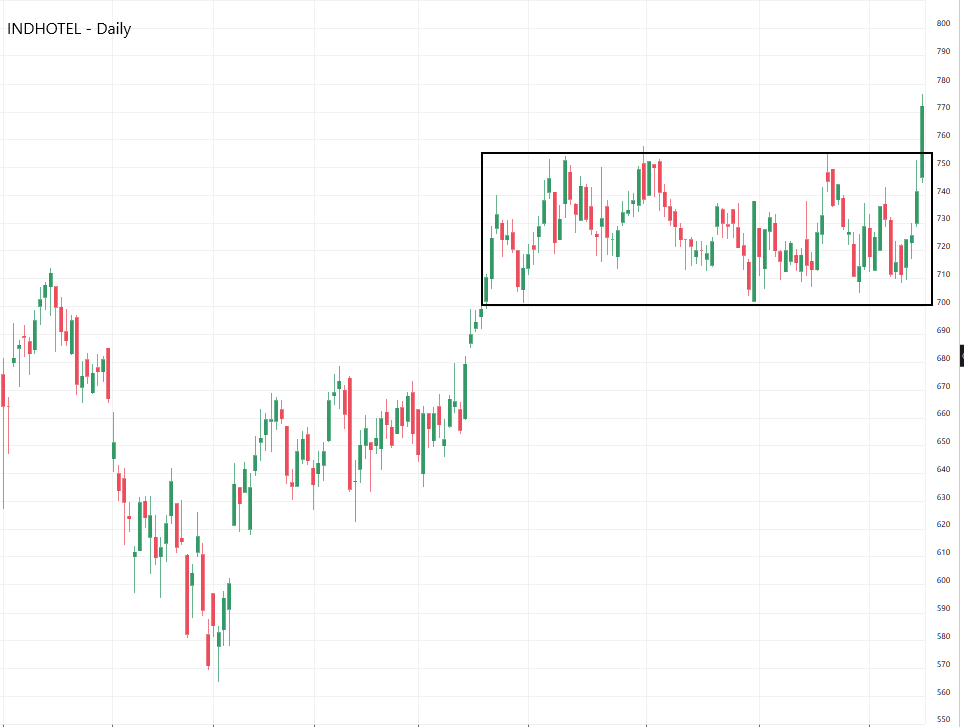
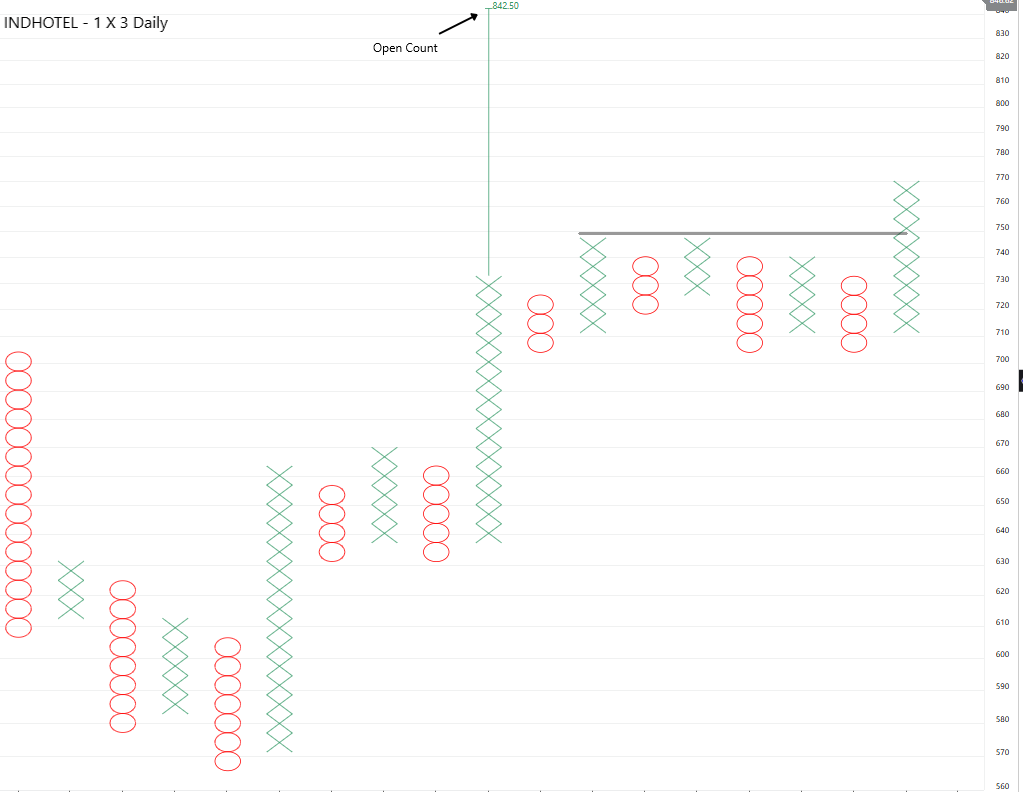
INDHOTEL 

/

INDHOTELS has shown a strong recovery on the daily chart, rising from 565 to above 700. Following this upmove, the stock consolidated in the 700–753 range for an extended period, with the 745–753 zone acting as an important resistance area. The stock has now broken above this range with a strong bullish candle and closed near 770, indicating renewed buying interest. 

The Point & Figure chart (1% × 3) also supports this bullish setup. After moving sideways below the 748 resistance level, the latest column of X's has broken above this zone and reached around 768. The Open Count projects a potential upside target of 842.50. As long as the stock holds above the 745–753 breakout zone, the chances of continuing towards this target remain positive. 

DIXONTECH 

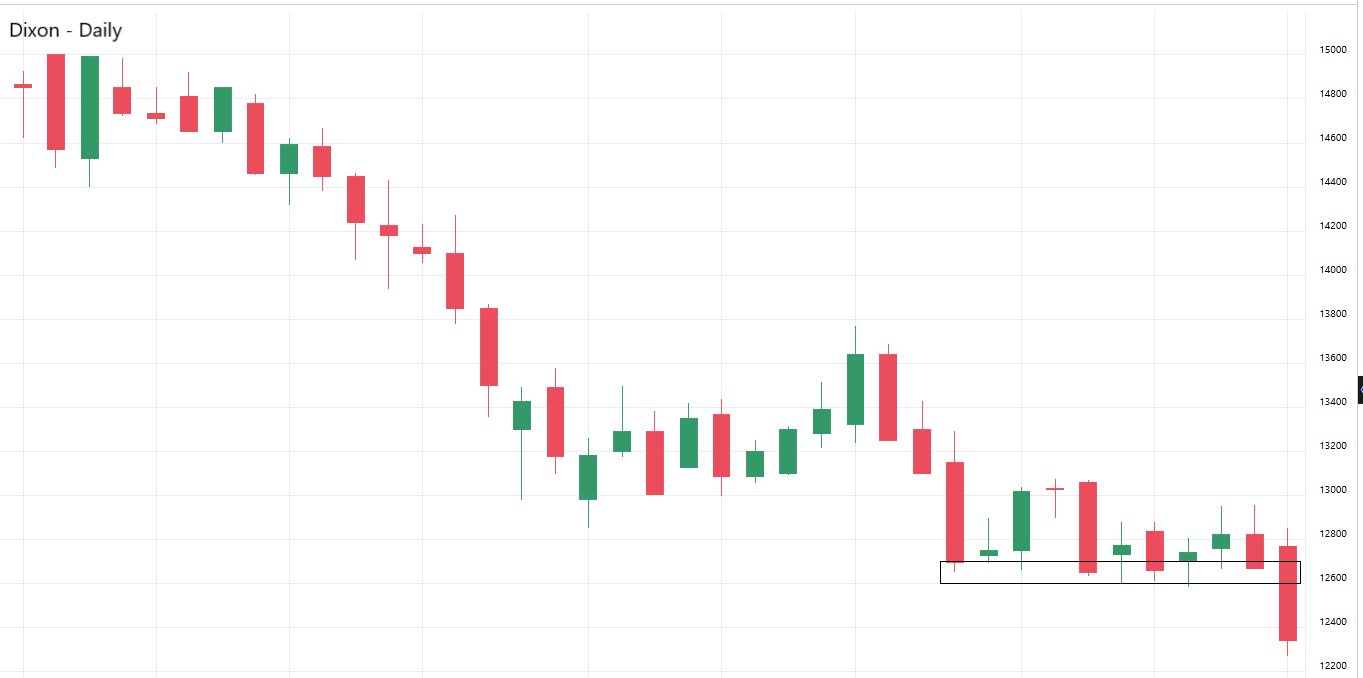
DIXONTECH has been in a clear downtrend on the daily chart, falling from 15,000 to around 12,650. Following this decline, the stock consolidated in the 12,600–13,050 range, with the 12,600–12,680 zone acting as an important support area. The stock has now broken below this support zone with a strong bearish candle and closed near 12,320, indicating further selling pressure. 

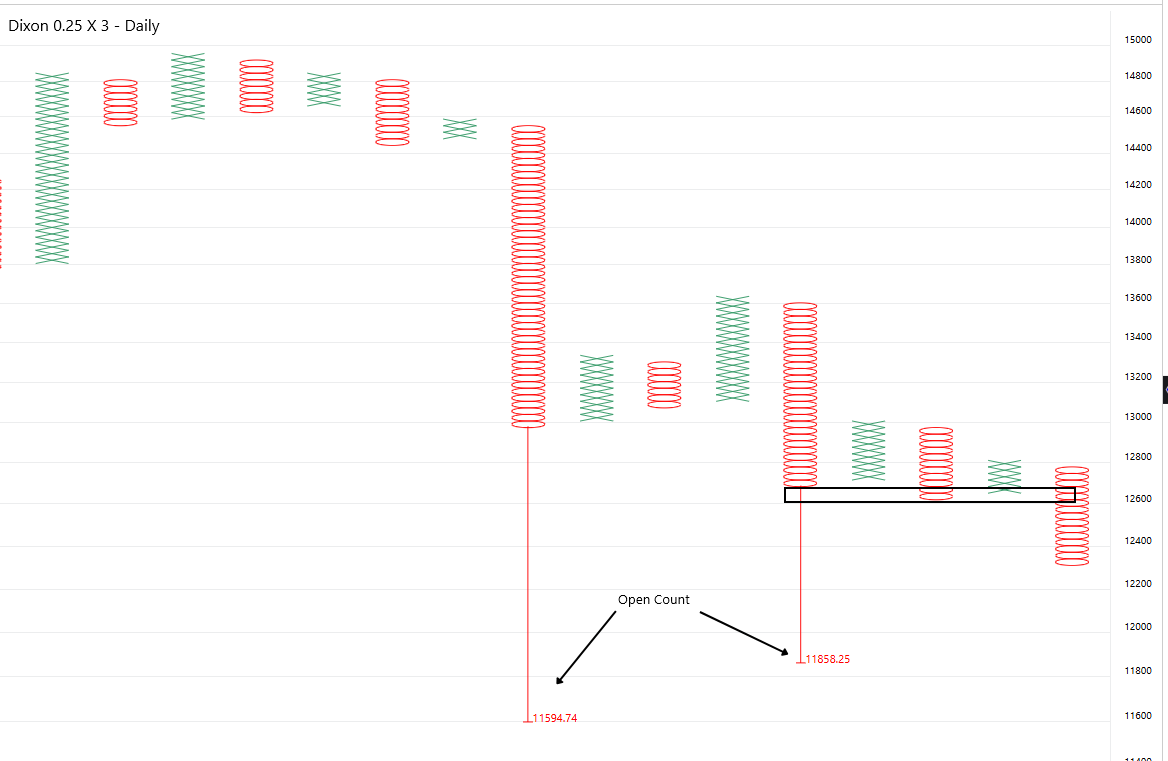
The Point & Figure chart (0.25% × 3) also supports this bearish setup. After moving sideways above the 12,600 support level, the latest column of O's has broken below this zone and reached around 12,300. The Open Count projects downside targets of 11,858 and 11,595. As long as the stock remains below the 12,600–12,680 zone, the bearish outlook remains intact, with the possibility of further downside towards these targets. 

Nifty Flips The Script on Heikin Ashi

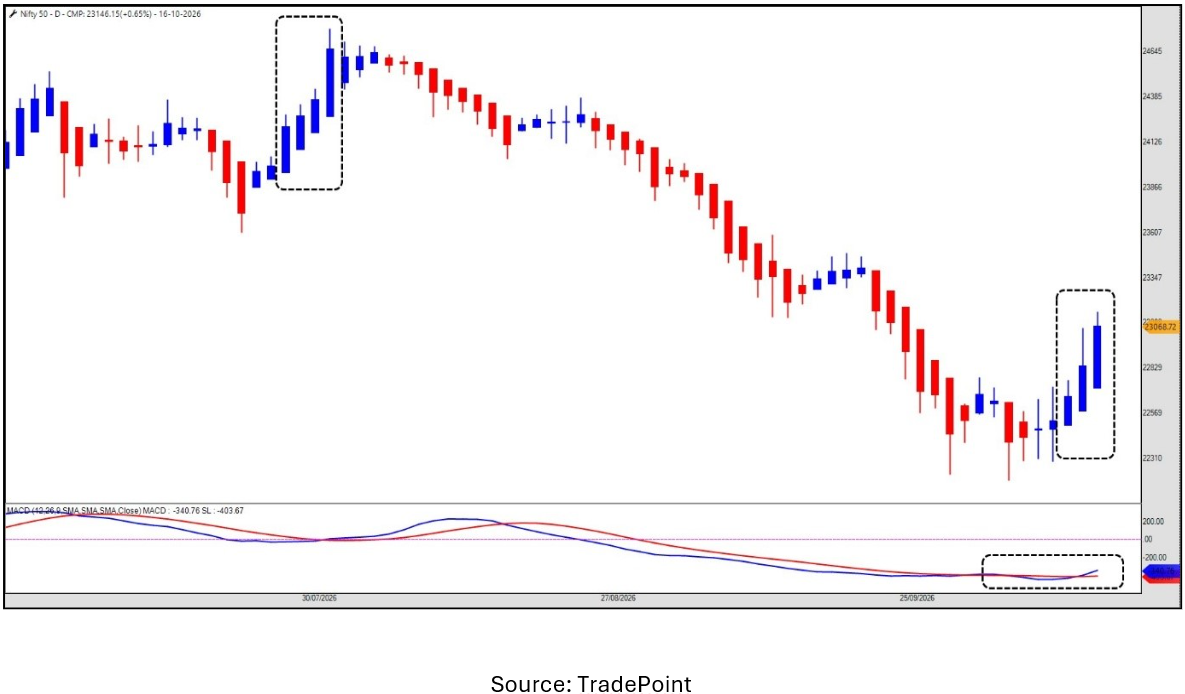
For almost three months the Nifty chart has been telling the same story of sell on rallies, respect the downtrend and not get carried away by temporary bounces. The index had struggled to find its feet since the highs of July 2026 with lower highs and lows keeping bullish expectations in check.  

The latest daily Heikin Ashi chart is indicating a change of behaviour. We can see a series of bullish candles with relatively wide bodies. The MACD has given a bullish crossover and the RSI status of Nifty 50 constituents shows positive momentum is widespread across a large part of the index.  

The question for traders is not whether Nifty has fallen enough anymore. The more relevant point is market started to act differently and how do we trade that change without jumping the gun?   


Clue One: Heikin Ashi Is Changing the Narrative  

Following the July highs, the price action was dominated by bearish candles through August and September. Finally, the index approached the 22,200-22,400 zone where the fall started to run out of steam.  

Now the candles are saying something else.  

Nifty has started to make consecutive bullish Heikin Ashi candles including candles with bigger bodies. This is important because traders are seeing more than one wide spread green candle after a large fall. They are seeing a series that suggests buying pressure is becoming more persistent.  

A large-bodied bullish Heikin Ashi candle indicates a more significant directional trend in the smoothed price series. If such candles appear in a row after a long decline, they may suggest that the balance between buyers and sellers is shifting.   

Clue Two: MACD Crossover 

The MACD is also now bullish as its line has crossed above the signal line. This adds to the emerging reversal narrative.  

In the last decline, bearish momentum was firmly in control. The bullish crossover indicates that this momentum may be coming to an end and buyers are starting to make their presence felt.  

A bullish crossover below zero can be an early warning of a reversal, but it does not confirm a change in the overall trend to bullish. Nifty may be witnessing a recovery rally within a larger downtrend.  

So how should traders use this information?  

The setup is more convincing when there is a combination of price action and momentum improvement. If Nifty struggles near resistance of 23,400-23,600 and MACD turns down again, traders should be careful to assume the recovery as a confirmed trend change.  


Clue Three: The RSI Dashboard: Is the Strength Broad?  

The RSI dashboard looks at the momentum status of all 50 Nifty constituents, enabling traders to look beyond the index chart.  

Source - Rzone

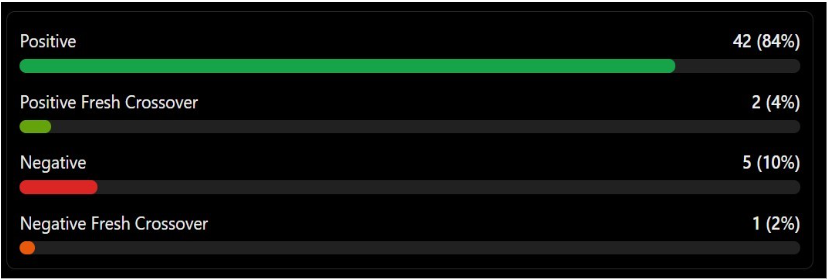
The first number is worth noting. 42 stocks, or 84% of Nifty 50 constituents, fall in the positive category.  

That implies momentum is broadening out beyond a handful of index heavyweights. The vast majority of constituents are seeing favourable RSI conditions.  Two other stocks have scored new positive crossovers, the momentum is beginning to improve.  

The positive and fresh-positive categories are combined and 44 stocks, or 88 percent of the index, fall in these two groups.  

On the weaker side, five stocks are under negative category and one has registered a fresh negative crossover.  

If Nifty breaks resistance and a large part of its constituents maintain positive momentum, then the breakout has broader support. If the index is rising but the number of stocks in positive territory starts to decline, the rally may be losing steam.   Creating a Trading Plan from the Signals  

The three indicators have different purposes. Heikin Ashi helps to spot a potential trend reversal, MACD helps to spot momentum and RSI dashboard helps to spot the breadth of positive momentum amongst constituents.   Scenario 1: Nifty breaks resistance If the index continues its bullish Heikin Ashi sequence, moves above a clearly defined swing high on the regular chart and the MACD continues strengthening, traders can look for a bullish trade. The entry should be based on real market prices, the stop-loss should be associated with the chart structure, and the position size should be proportional to the risk.  

 Scenario 2: Nifty rises but unable to clear resistance. Do not chase the market just because few bullish candles are seen. Traders can wait for a breakout, a retest or a fresh setup rather than just entering because the candles turned green. 

 Scenario 3: The turnaround stalls. If bearish Heikin Ashi candles return, the MACD crossover fails, or Nifty breaks a recent swing low, the bullish thesis needs to be reconsidered. It is more important to protect capital than to defend an earlier view of the market.  

FII — DII Activity

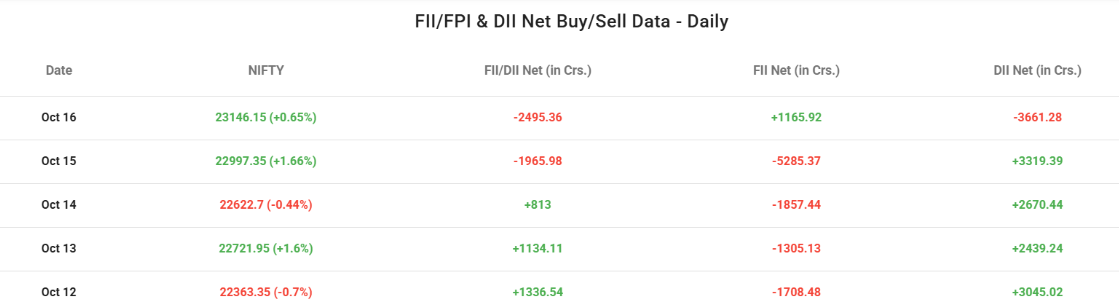
Foreign investors remained net sellers for most of the week, though the pace of selling was lighter than in the previous week. FIIs sold around ₹1,708 crore on Monday, 12 Oct, followed by selling of ₹1,305 crore on Tuesday and ₹1,857 crore on Wednesday. Selling intensified on Thursday, with outflows of around ₹5,285 crore, before FIIs turned buyers on Friday with purchases of approximately ₹1,166 crore. Overall, FIIs were net sellers of around ₹8,991 crore during the week. 

Domestic institutions stayed supportive for most of the week and absorbed much of the foreign selling. DIIs bought around ₹3,045 crore on Monday, ₹2,439 crore on Tuesday and ₹2,670 crore on Wednesday. Their buying rose on Thursday to around ₹3,319 crore, before they turned sellers on Friday with outflows of approximately ₹3,661 crore. Overall, DIIs ended the week as net buyers of around ₹7,813 crore. 

Overall, FIIs remained net sellers during the week, while DIIs offset a large part of the foreign outflow, though Friday saw the roles reverse as FIIs bought and DIIs sold. The combined institutional net flow was negative at around ₹1,178 crore. Even so, the market rallied strongly. Nifty closed at 23,146.15 on Friday, 16 Oct, compared with 22,363.35 on Monday, 12 Oct, registering a weekly gain of around 3.50%. Measured against the previous Friday’s close of 22,520.45, the weekly gain was around 2.78%. 

FII, PRO & CLIENT POSITIONING – WEEKLY VIEW

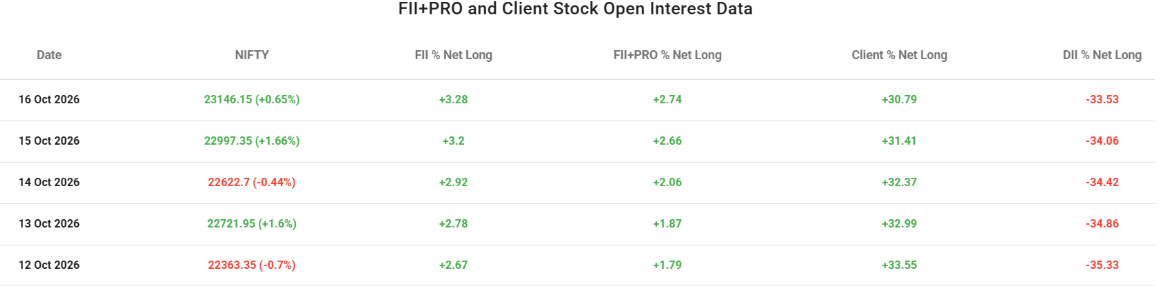
During the week, Nifty posted a strong gain, closing at 23,146.15 on Friday, 16 Oct, compared with 22,363.35 on Monday, 12 Oct, a weekly rise of around 3.50%. The index fell on Monday (-0.7%) and Wednesday (-0.44%), but gained on Tuesday (+1.6%), Thursday (+1.66%) and Friday (+0.65%). Monday’s close of 22,363.35 was the week’s low, after which the index moved steadily higher to end at the week’s high on Friday. 

FII positioning in stock open interest improved steadily, with FII % Net Long rising from +2.67% on 12 Oct to +3.28% on 16 Oct. The figure increased on every trading day of the week, showing that FIIs gradually added to their net long exposure as the market moved higher. 

FII+PRO % Net Long also rose consistently, moving from +1.79% to +2.74%. The increase of nearly one percentage point was larger than that of FIIs alone, which suggests professional traders also added to their long positions during the rally. 

Client positioning remained strongly positive but eased throughout the week, with Client % Net Long declining from +33.55% on 12 Oct to +30.79% on 16 Oct. The figure fell every day, which indicates that clients booked profits or trimmed their long exposure into the rising market. 

DIIs continued to hold a large net short position, but it narrowed steadily, with DII % Net Long improving from -35.33% on 12 Oct to -33.53% on 16 Oct. This shows a gradual reduction in their net short exposure over the week. 

Overall, FIIs and FII+PRO steadily built their net long positions, while clients reduced their long exposure and DIIs trimmed their shorts. This gradual shift from clients toward institutional and professional participants came alongside a strong 3.5% rally in Nifty, which points to improving institutional confidence. Client positioning still remains heavily net long and DIIs remain deeply net short, so the market’s overall positioning is still lopsided, though it became somewhat more balanced by the end of the week. 

Future Open Interest Buildup

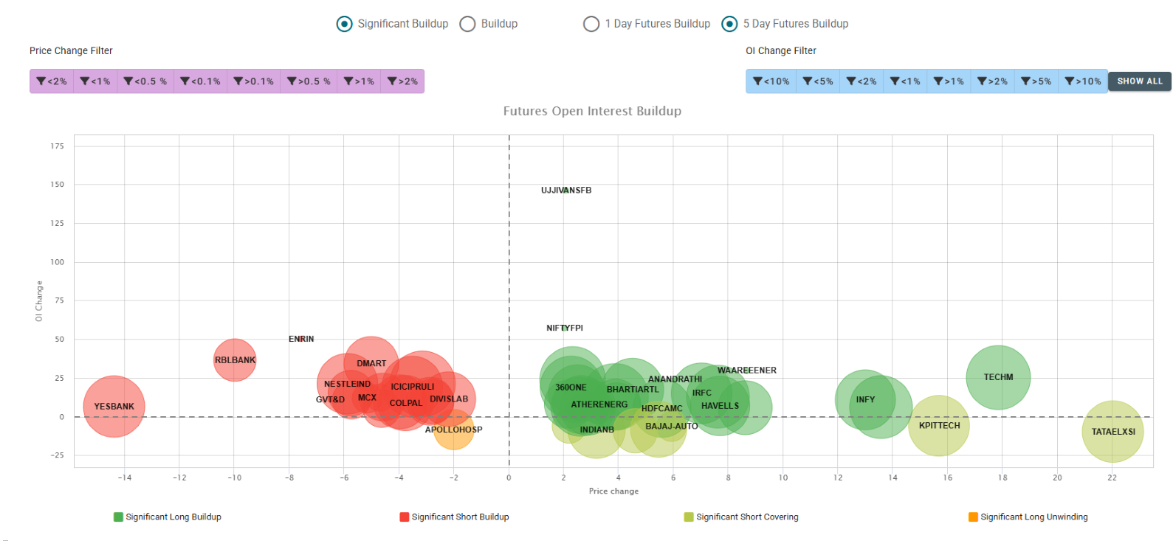
The futures market showed a positive tilt this week, with significant long buildup and short covering dominating the upside, while significant short buildup remained visible in a cluster of stocks on the downside. 

On the positive side, Tech Mahindra, Infosys, Bharti Airtel, 360 ONE, Ather Energy, Anand Rathi, IRFC, Havells and Waaree Energies saw rising prices along with increasing Open Interest, pointing to fresh long buildup. Tech Mahindra stood out with a gain of nearly 18%, while Ujjivan Small Finance Bank recorded a very sharp rise of over 140% in Open Interest alongside a modest price gain. 

Meanwhile, Tata Elxsi, KPIT Technologies, Bajaj Auto, HDFC AMC and Indian Bank witnessed short covering, as their prices rose while Open Interest declined. Tata Elxsi was the top gainer on the chart with a rise of over 20%, and KPIT Technologies also gained around 16%, highlighting strong short covering in IT stocks. 

On the other hand, Yes Bank, RBL Bank, DMart, Nestle India, GE Vernova T&D, MCX, ICICI Prudential Life, Colgate-Palmolive and Divi’s Laboratories witnessed falling prices along with rising Open Interest, indicating fresh short positions. Yes Bank was the weakest, falling around 14%, while RBL Bank declined around 10% with a rise of nearly 30% in Open Interest. Enrin also recorded a significant increase in Open Interest of around 50% alongside a price decline. 

Apollo Hospitals saw long unwinding, as both its price and Open Interest declined. 

The size of each bubble represents the stock’s Volume Percentile, with larger bubbles highlighting stocks that witnessed unusually high futures trading activity compared with the past year. 

Overall, long buildup and short covering were the key themes, with IT stocks in particular showing strong momentum. However, short buildup in banking, FMCG and select financial stocks indicates continued pressure in some pockets, so the futures setup remains positive but not one-sided.

Stocks In Action

Every month, mutual funds publish their portfolio holdings for the previous month by the 12th, giving investors a regular window into how institutional money is being positioned. Tracking these disclosures can help identify the stocks where fund managers have been adding to or trimming their holdings. 

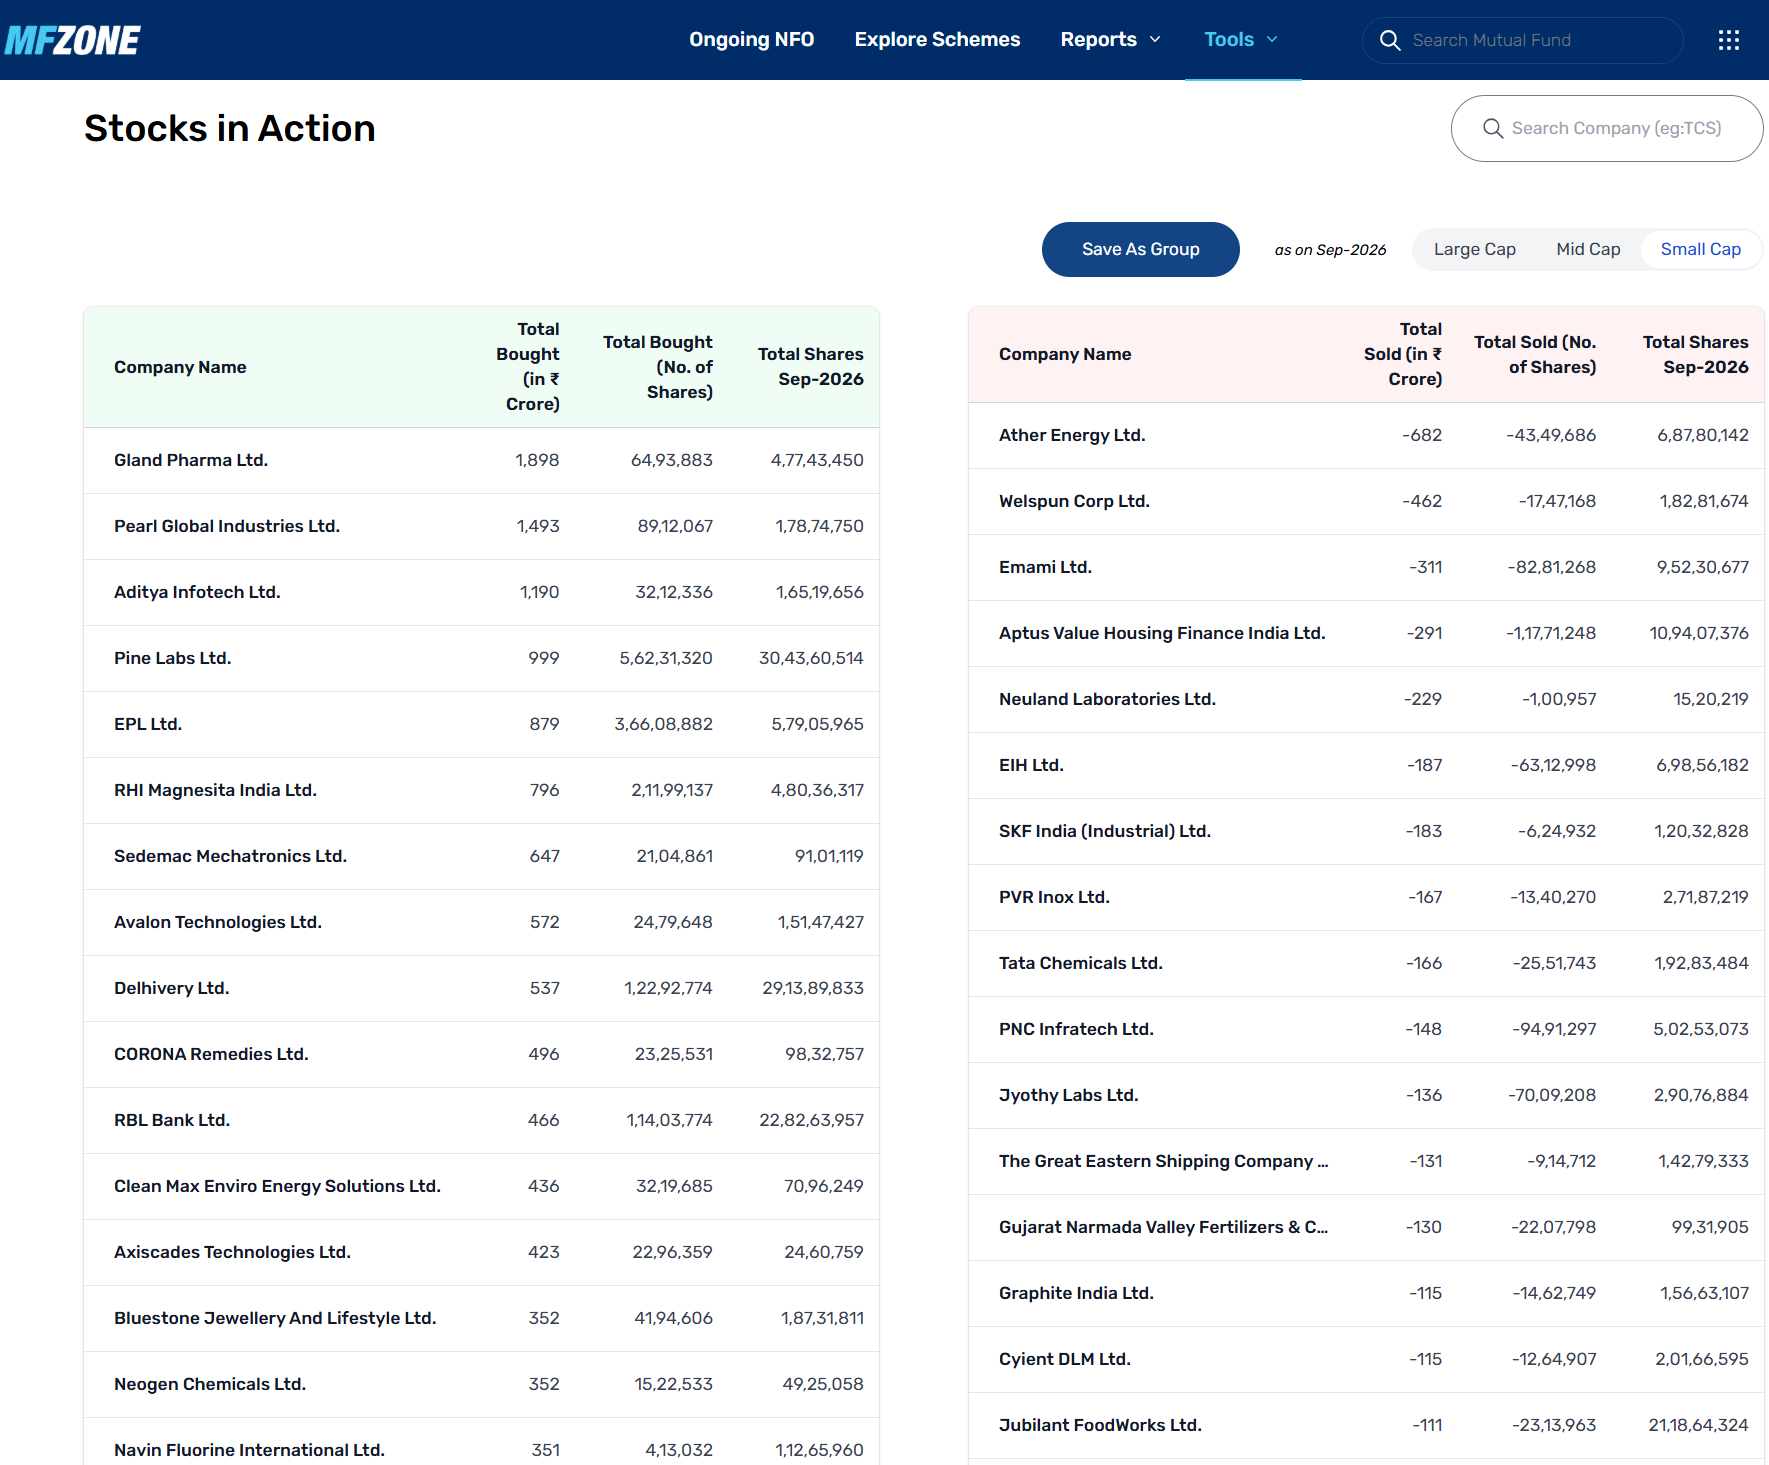
The Stocks in Action tool on MFZone puts this data in one place. It shows the total value and number of shares bought or sold by mutual funds during the month, along with their total holdings at the end of the period. Users can switch between Large Cap, Mid Cap and Small Cap stocks to see how institutional activity differs across market segments. 

With the September 2026 portfolio disclosures now available, the tool highlights the stocks that attracted the most mutual fund buying and selling during the month. Below is the list of Small Cap stocks that saw the highest mutual fund activity in September 2026. 

Key highlights 

Top buys: Gland Pharma led the buying list, with mutual funds adding shares worth ₹1,898 crore. It was followed by Pearl Global Industries (₹1,493 crore), Aditya Infotech (₹1,190 crore) and Pine Labs (₹999 crore). Pine Labs also saw the largest buying by volume, with over 5.62 crore shares added. 

Top sells: Ather Energy saw the highest selling at ₹682 crore, followed by Welspun Corp (₹462 crore), Emami (₹311 crore), Aptus Value Housing Finance (₹291 crore) and Neuland Laboratories (₹229 crore). 

Sector spread: Buying was spread across pharma, technology, manufacturing and financials, including Sedemac Mechatronics, Avalon Technologies, Delhivery and RBL Bank. Selling included several consumer and industrial names such as Jyothy Labs, PVR Inox, SKF India (Industrial) and Jubilant FoodWorks. 

These shifts in institutional ownership can be a useful starting point for further research. Investors should look at the company’s business, earnings and valuations to judge whether the activity reflects growing confidence in the stock or a deliberate reduction in exposure. 

Warning Sign

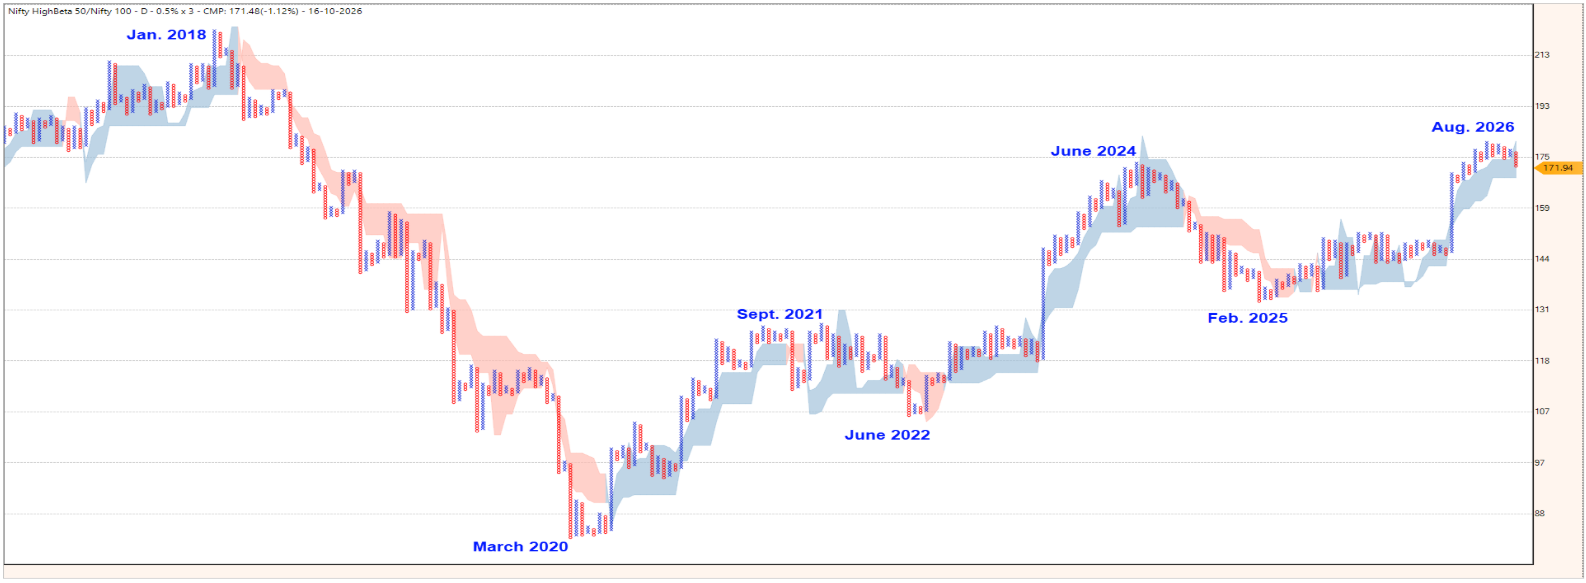
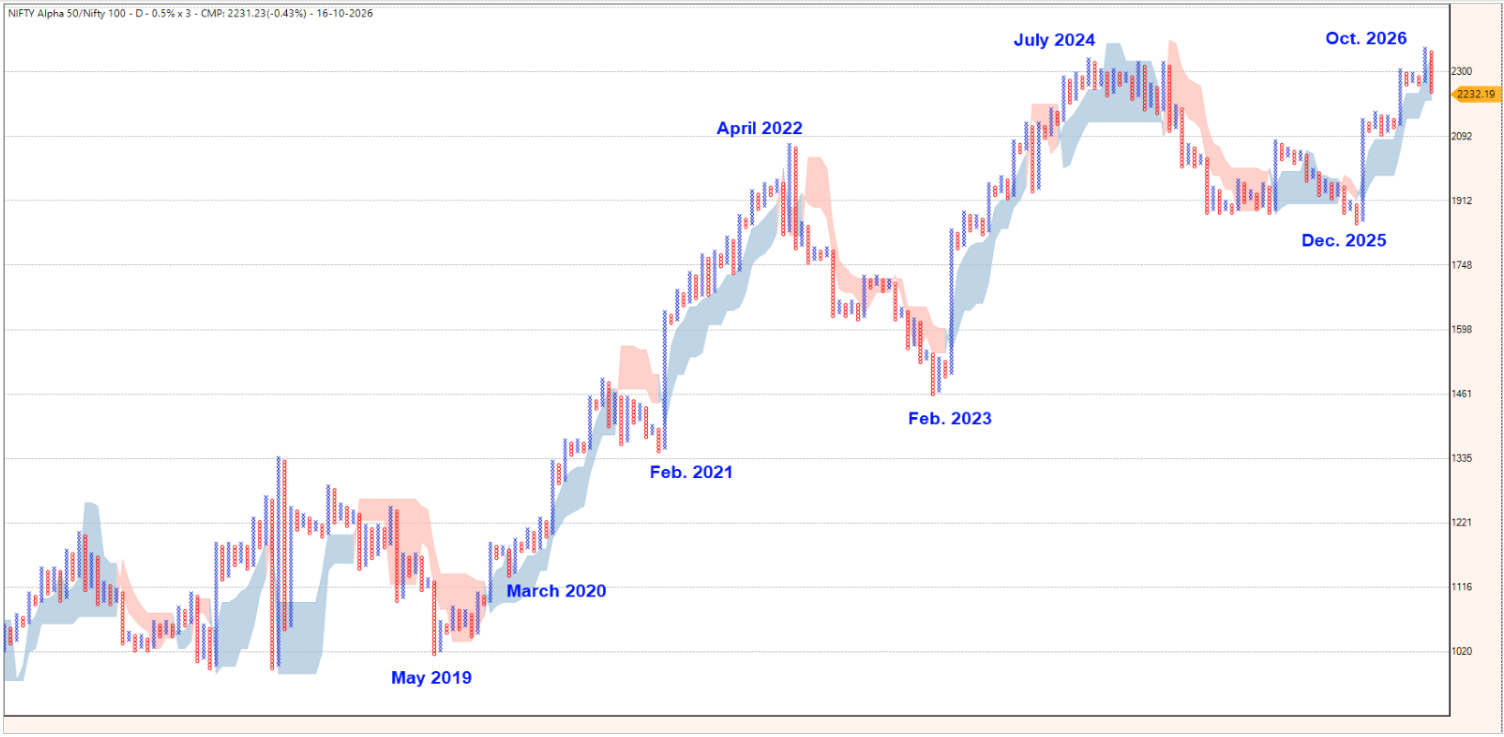
We talked about an interesting market timing mechanism using the Nifty High Beta50 index and the Nifty Alpha50 index. Just to recap, the ratio chart of these two indices in relation to the large cap stocks has an interesting correlation to major market turning points. Take a look at the charts featured below.  

The chart above captures the relative performance of Nifty High Beta50 index versus Nifty 100 index. Notice how the major turning points in this chart captured major trend reversal in the markets.  

What is of interest now is the recent turn lower in this chart in the past few weeks. Though the RS chart is still hovering above the D SMART line, the series of double bottom sell signals is something to be concerned about.  

A chart above captures the relative performance of Nifty Alpha50 index versus Nifty 100 index. Again, the RS chart captures the key inflexion points in the market and the recent reversal is a cause of concern.  

As observed in last week’s newsletter, there is a possibility of a short-term bounce in the large cap universe, "but this not likely to be good enough to trigger new highs in the market"  

The broader message is to be cautious, especially in mid, small and microcap stocks. Do not look for a trend following style of trading in the short term. Try to lock profits aggressively.  

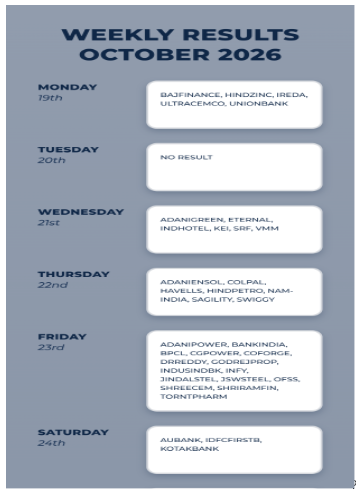
Weekly Result Calendar

.


The Market Pulse

Weekly Indian Equity Intelligence — Issue #22

Data sourced from NSE, BSE, SEBI

Not investment advice. For educational use only.

Entity & Registrations

Definedge Securities Broking Private Limited

Registration No.

INH000010344

BSE Enlistment

5631

CIN

U65990PN2021PTC198378

Registered Office Address: 2nd Floor, Ambashish, Lane No. 9, Pakharbag, NDA Pashan Road, Bavdhan, Pune, Maharashtra, 411021

Compliance and Grievance Officer: Bhagyashree Zad

Contact No: 9922918835, 9867677402

Email ID: [email protected]

This report has been prepared by Research Analyst and is solely for information of the recipient only. The report must not be used as a singular basis of any investment decision. The views herein are of a general nature and do not consider the risk appetite or the particular circumstances of an individual investor; readers are requested to take professional advice before investing. Nothing in this document should be construed as investment advice. Each recipient of this document should make such investigations as they deem necessary to arrive at an independent evaluation of an investment in securities of the companies referred to in this document (including merits and risks) and should consult their own advisors to determine merits and risks of such investment.

The information and opinions contained herein have been compiled or arrived at, based upon information obtained in good faith from sources believed to be reliable. Such information has not been independently verified and no guaranty, representation of warranty, express or implied, is made as to its accuracy, completeness or correctness. All such information and opinions are subject to change without notice. Descriptions of any company or companies or their securities mentioned herein are not intended to be complete. Research Analyst is not obliged to update this report for such changes. Research Analyst has the right to make changes and modifications at any time.

This report is not directed to, or intended for display, downloading, printing, reproducing or for distribution to or use by, any person or entity who is a citizen or resident or located in any locality, state, country or other jurisdiction where such distribution, publication, reproduction, availability or use would be contrary to law or regulation or what would subject Research Analyst or its affiliates to any registration or licensing requirement within such jurisdiction. If this report is inadvertently sent or has reached any person in such country, especially, United States of America, the same should be ignored and brought to the attention of the sender. This document may not be reproduced, distributed or published in whole or in part, directly or indirectly, for any purposes or in any manner. It should not be considered to be taken as an offer to sell or a solicitation to buy any security. This document is not, and should not, be construed as an offer or solicitation of an offer, to buy or sell any securities or other financial instruments. This report should not be construed as an invitation or solicitation to do business with Research Analyst.

Research Analyst do not take any responsibility, financial or otherwise, of the losses or the damages sustained due to the investments made or any action taken on basis of this report.

The following Disclosures are being made in compliance with the SEBI Research Analyst Regulations 2014 (herein after referred to as the Regulations)

Definedge Securities Broking Private Limited ("Research Entity") is registered with SEBI as Research Analyst with Registration No. INH000010344, BSE Enlistment No.: 5631. The research entity got its SEBI registration on 21-Oct-22 and is engaged in research and recommendation Services. The focus of Research entity is to provide research and recommendations services to the clients. Analyst aligns its interests with those of the client and seeks to provide the best suited services.

  • ●Research entity has no material adverse disciplinary history as on the date of publication of this report.
  • ●Research entity has no associates
  • ●Research entity or its associate or Research Analyst or his relative have no financial interest in the securities recommended.
  • ●There are no actual or potential conflicts of interest arising from any connection of Research entity or its associate or Research Analyst or his relative to or association with any issuer of products/ securities, including any material information or facts that might compromise its objectivity or independence in the carrying on of Research Analyst services. Such conflict of interest shall be disclosed to the client as and when they arise.
  • ●Research entity or its associate or Research Analyst or his relative, may have actual/beneficial ownership of one per cent or more securities of the subject company, at the end of the month immediately preceding the date of publication of the research report or date of the public appearance or research recommendation.
  • ●Research entity or its associate or Research Analyst or his relative has no connection or association of any sort with any issuer of products/ securities recommended herein.
  • ●Research entity or its associate or Research Analyst or his relative has no actual or potential conflicts of interest arising from any connection to or association with any issuer of products/ securities, including any material information or facts that might compromise its objectivity or independence in the carrying on of research and recommendations services.
  • ●Research entity or Research analyst or its associates has not received any kind of remuneration or consideration form the products/ securities recommended herein.
  • ●Research entity or Research analyst or its associates have not received any compensation from the subject company in past 12 months.
  • ●Research entity or Research analyst or its associates have not managed or co-managed the public offering of Subject Company in past 12 months.
  • ●Research entity or Research analyst or its associates have not received any compensation for investment banking or merchant banking of brokerage services from the subject company in past 12 months.
  • ●Research entity or Research analyst or its associates have not received any compensation for products or services other than investment banking or merchant banking or brokerage services from the subject company in the past twelve months
  • ●Research entity or Research analyst or its associates have not received any compensation or other benefits from the subject company or third party in connection with the research report or research recommendations.
  • ●Research entity or Research analyst or its associates have not received any compensation for products or services from the subject company in past 12 months.
  • ●The subject company is or was not a client of Research entity or Research analyst or its associates during twelve months preceding the date of distribution of the research report and recommendation services provided.
  • ●Research Analysts or its associates has not served as an officer, director or employee of the subject company.
  • ●Research Entity or Research Analysts has not been engaged in market making activity of the subject company
  • ●The research analyst has not used/ used artificial intelligence tools for preparation of the research report.