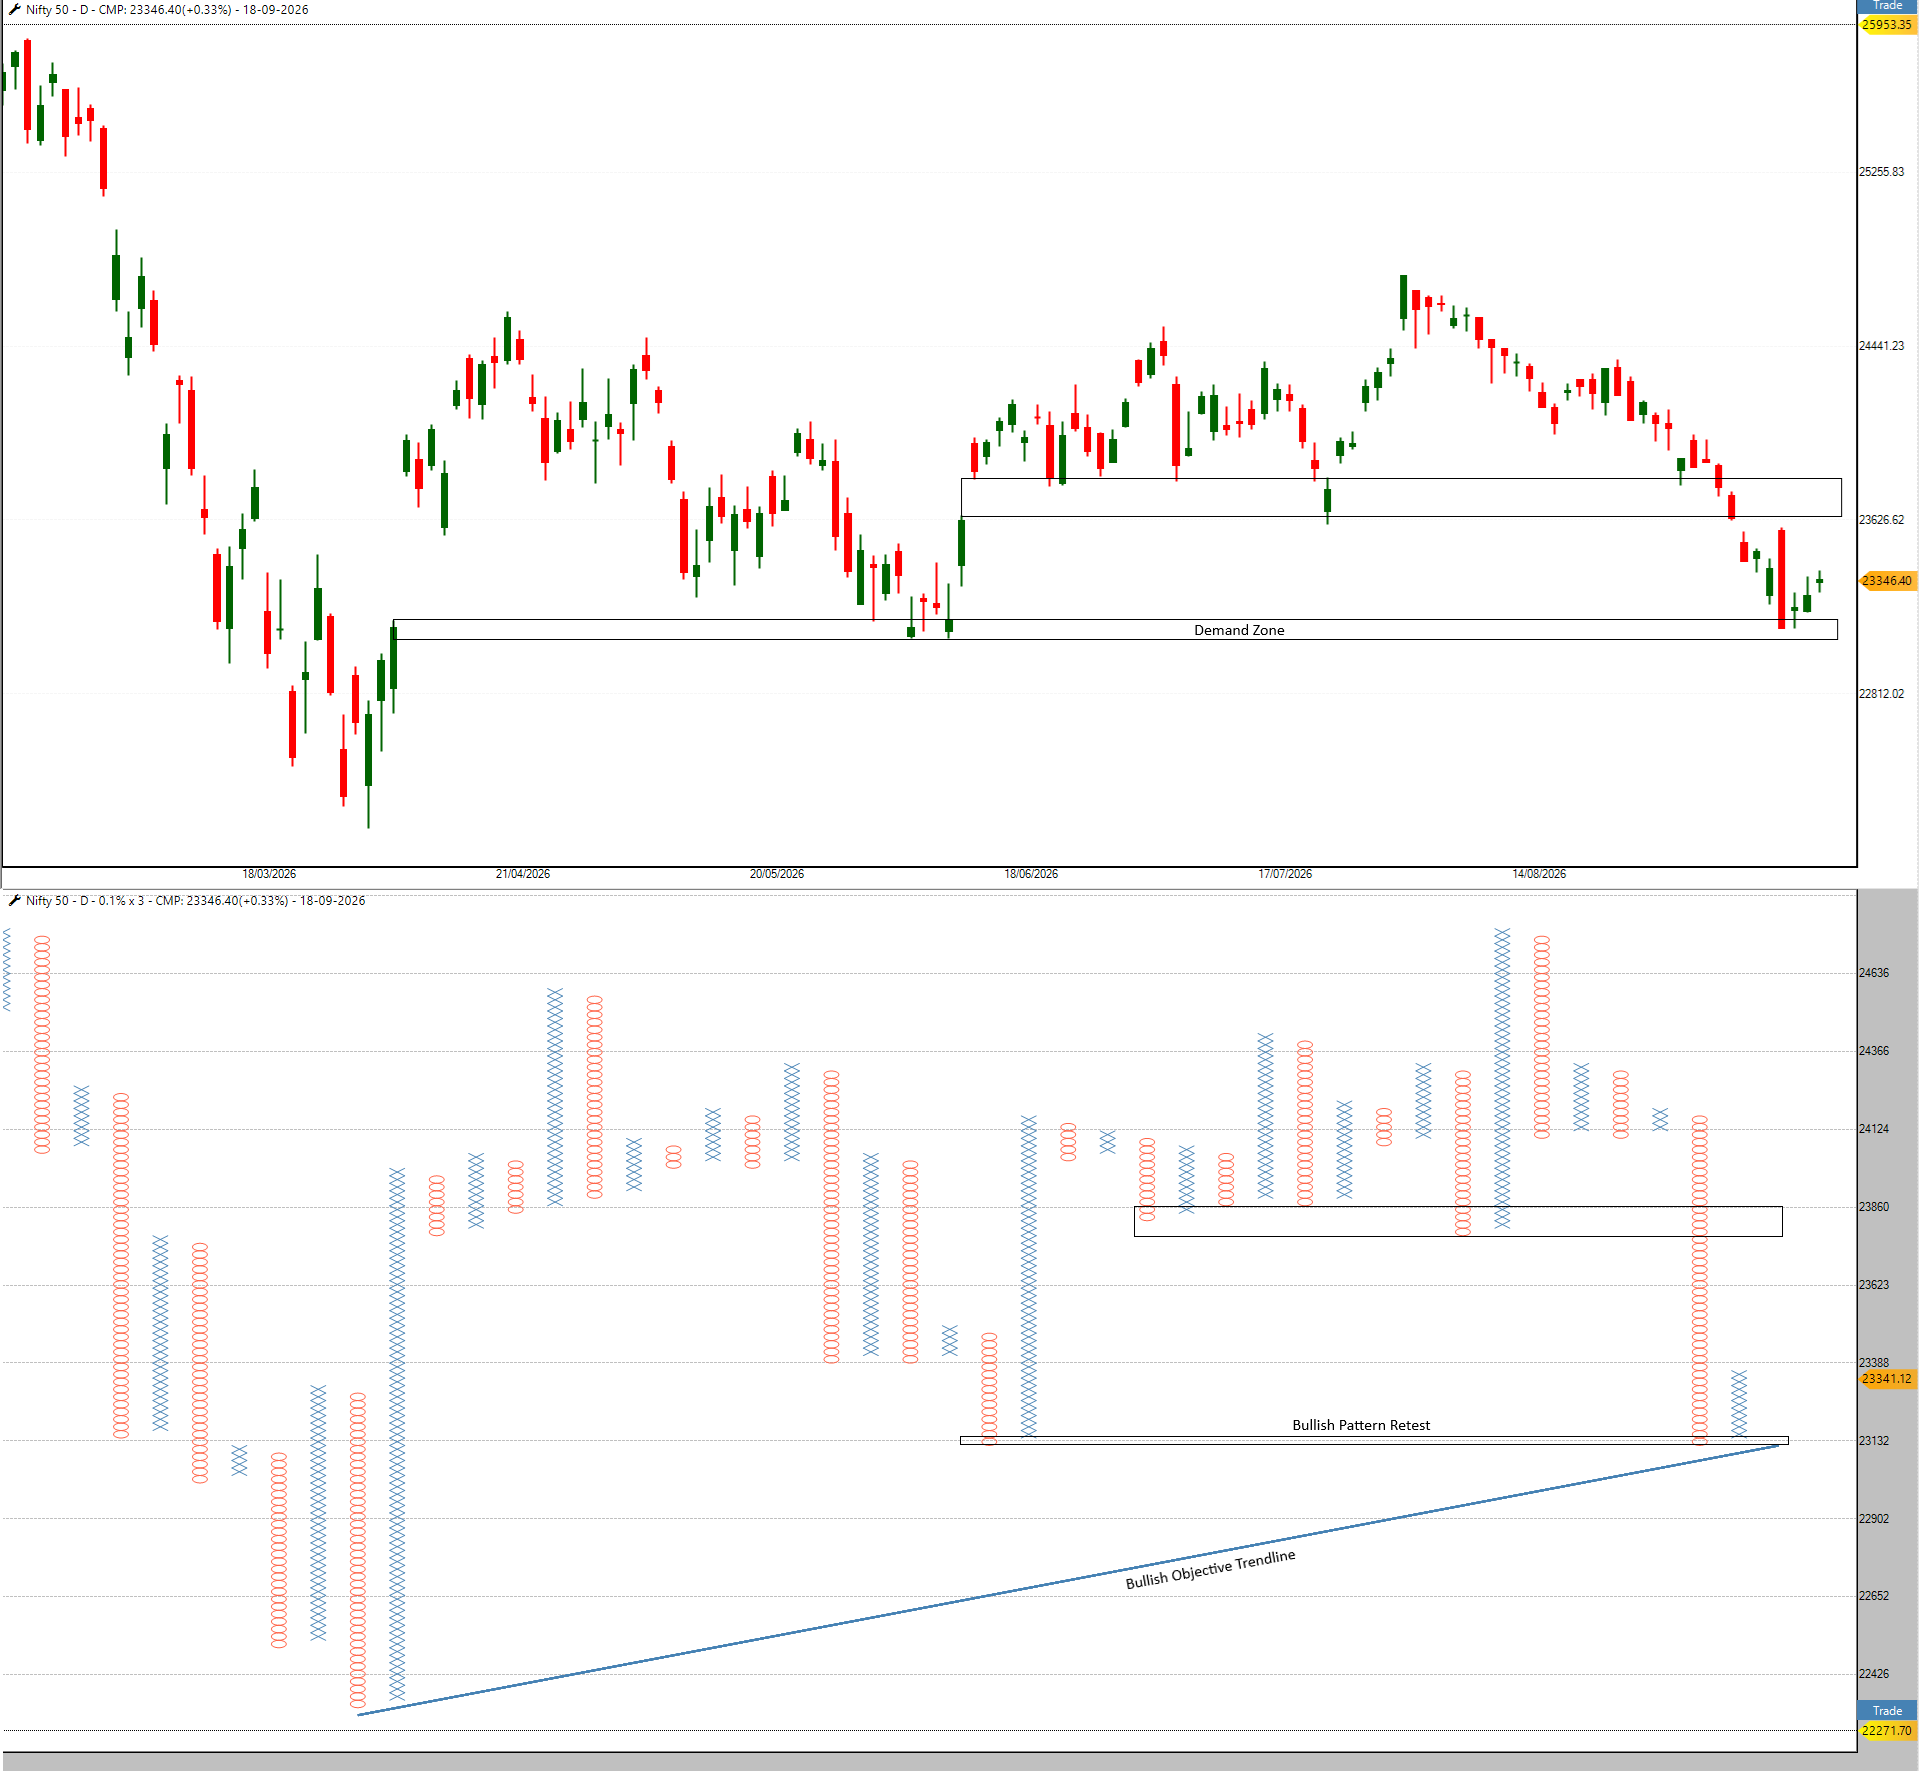
Nifty has now closed lower for seven weeks in a row, something we don’t see very often. The last time we saw a similar streak was in 2008 and interestingly after making its low, the market went on to recover nearly 20%. The longest losing streak, however, came in 2001, when Nifty fell for nine consecutive weeks.
On 15 September 2026, FII selling was higher than DII buying for the first time in nearly two months. FIIs sold around ₹2,978 crore, while DIIs bought around ₹2,686 crore. (August 31 is excluded due to MSCI rejig)In our last newsletter, we mentioned that the 23,050–23,150 zone could act as an important support area for Nifty. Nifty did exactly that; it came down to this zone and found support.
The US Fed rate decision on Wednesday and the Bank of Japan policy decision on Friday. The US Fed raised its policy rate by 25 basis points, from 3.75% to 4%, while the Bank of Japan also increased its policy rate by 25 basis points, from 1.00% to 1.25%. With both decisions now behind us, some of the immediate uncertainty around these events has cleared.
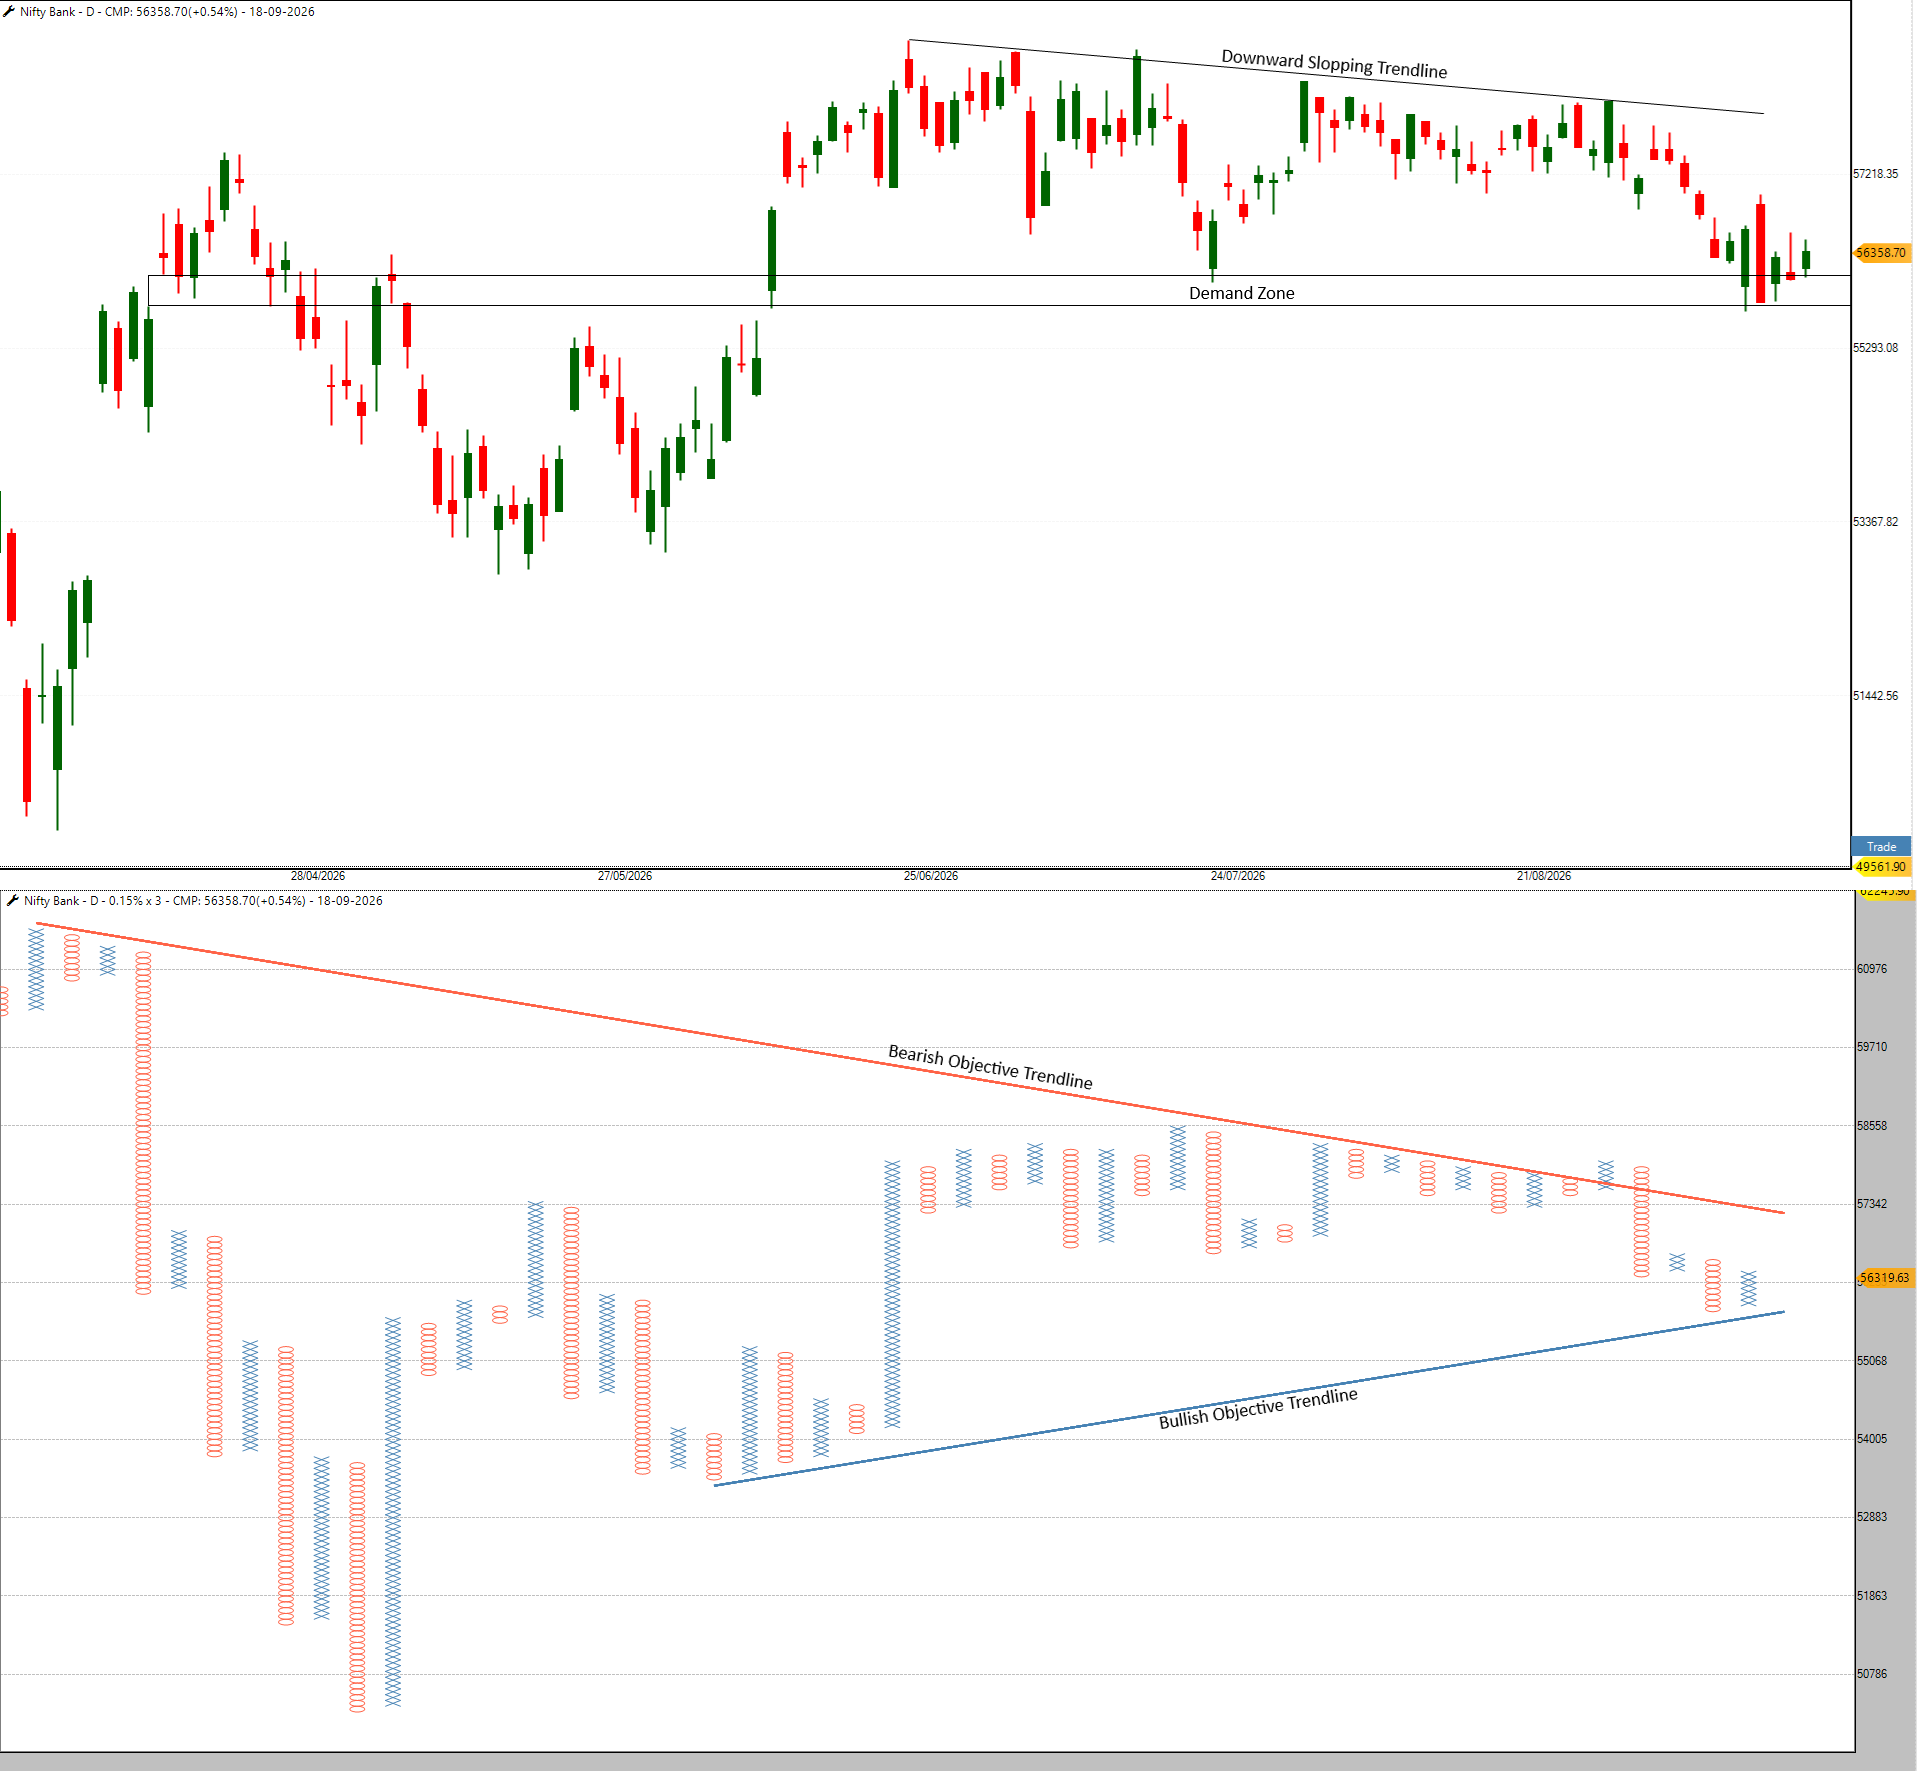
Bank nifty takes support at 55700-56100 Zone. A strong move above the 56,800 - 57,100 level could improve the chances of the index moving towards the 57,500 - 57,700 zone.
On the downside, a close below 55700, it could signal further weakness, with the 55,000 – 54,700 zone becoming the next important support area to watch.
Market Breadth
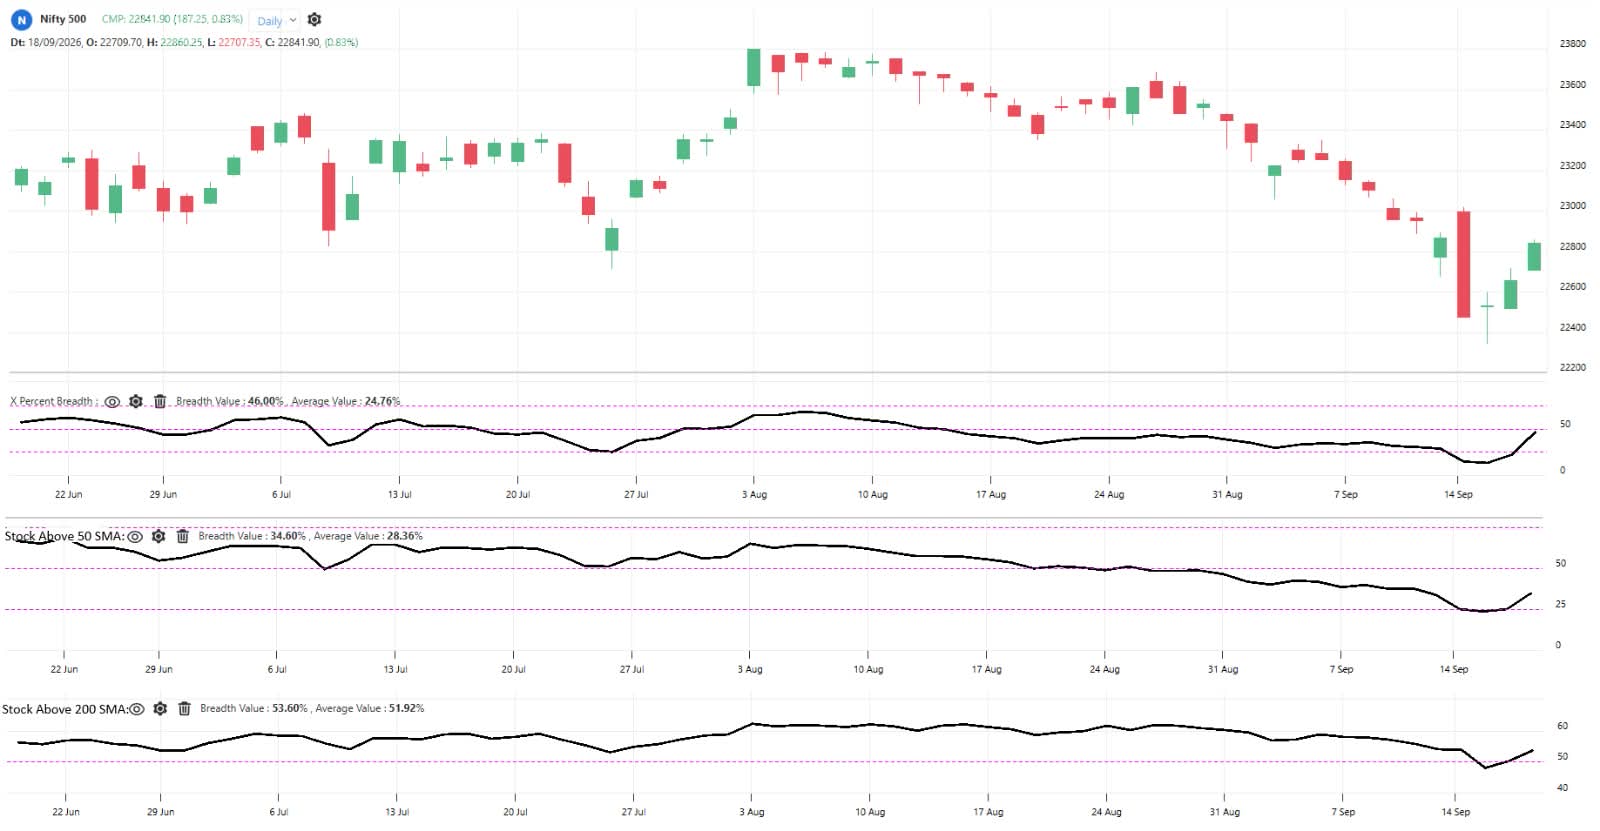
NIFTY 500 MARKET BREADTH
P&F X% Breadth
The P&F X% Breadth Indicator is currently at 46.00%, with around 230 stocks in the X column. The indicator remains in the neutral zone and has improved from the previous week, indicating some improvement in market breadth.
Stocks Above 50-Day Moving Average
The Stocks Above 50-Day Moving Average indicator is currently at 34.60%, with around 173 stocks trading above their 50-day moving average. The indicator remains in the neutral zone and has improved compared to the previous week, indicating better medium-term market participation.
Stocks Above 200-Day Moving Average
The Stocks Above 200-Day Moving Average indicator is currently at 53.60%, with around 268 stocks trading above their 200-day moving average. The indicator remains above the 50% level, indicating that long-term market participation continues to remain supportive.
Overall
Overall, the breadth indicators have improved compared to the previous week. P&F X% Breadth and 50-Day Moving Average breadth have recovered, while 200-Day Moving Average breadth remains above the 50% level. This suggests that market participation is improving, although short and medium-term breadth remains in the neutral zone.
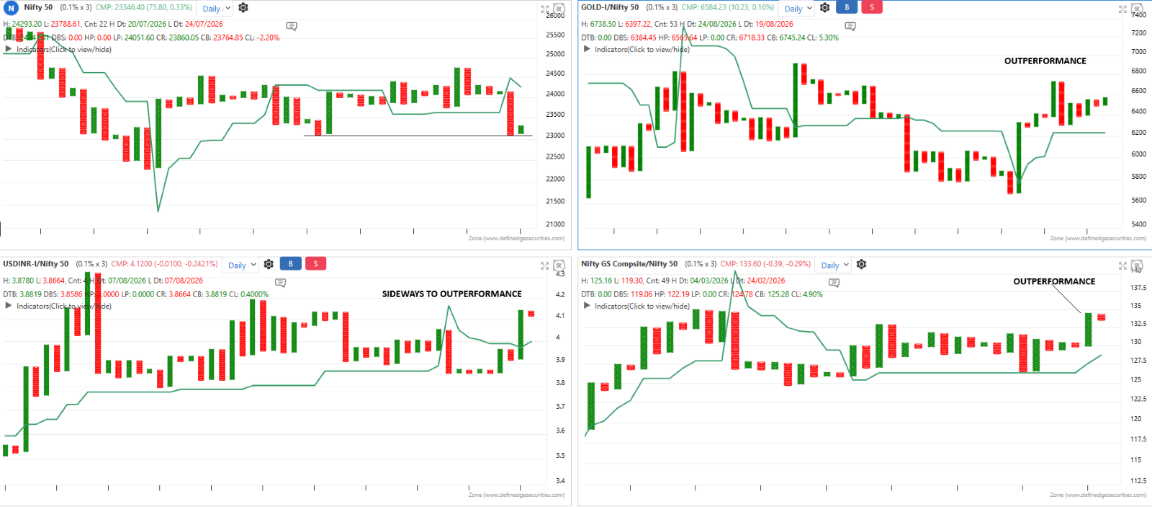
RELATIVE STRENGTH OF MAJOR ASSET CLASSES:
NIFTY 50 (TOP-LEFT CHART)
After the recent consolidation, the Nifty 50 is currently at support and remains in a positive column. However, the index is still trading below the D-Smart line, so it would be better to stay cautious until it moves back above the D-Smart line. The Nifty 50 X% Breadth is in neutralzone, suggesting that breakout strategy should work from here. In such conditions, breakout trades may offer favourable risk-reward opportunities.
GOLD VS NIFTY 50 (TOP-RIGHT CHART)
The Gold/Nifty 50 RS chart is currently in a positive column. After the sharp rise, Gold has given a pullback and is now moving sideways. A sustained move above the recent highs would further strengthen the relative strength.
USDINR VS NIFTY 50 (BOTTOM-LEFT CHART)
The USDINR/Nifty 50 RS chart is currently in a negative column and remains in bullish phase. A close above the previous Anchor Column would strengthen the setup further. Any close below the D-Smart line would weaken the chart.
NIFTY G-SEC COMPOSITE VS NIFTY 50 (BOTTOM-RIGHT CHART)
The Nifty G-Sec Composite/Nifty 50 RS chart is currently in a negative column, while the overall chart remains bullish. A close above the recent Bullish Anchor Column would strengthen the setup further. Any close below the D-Smart line would weaken the setup.
Overall, the intermarket setup remains mixed. Nifty 50 is at support but remains below the D-Smart line, while Gold continues to show positive relative strength. USDINR and bonds remain bullish in structure but are currently in negative columns.
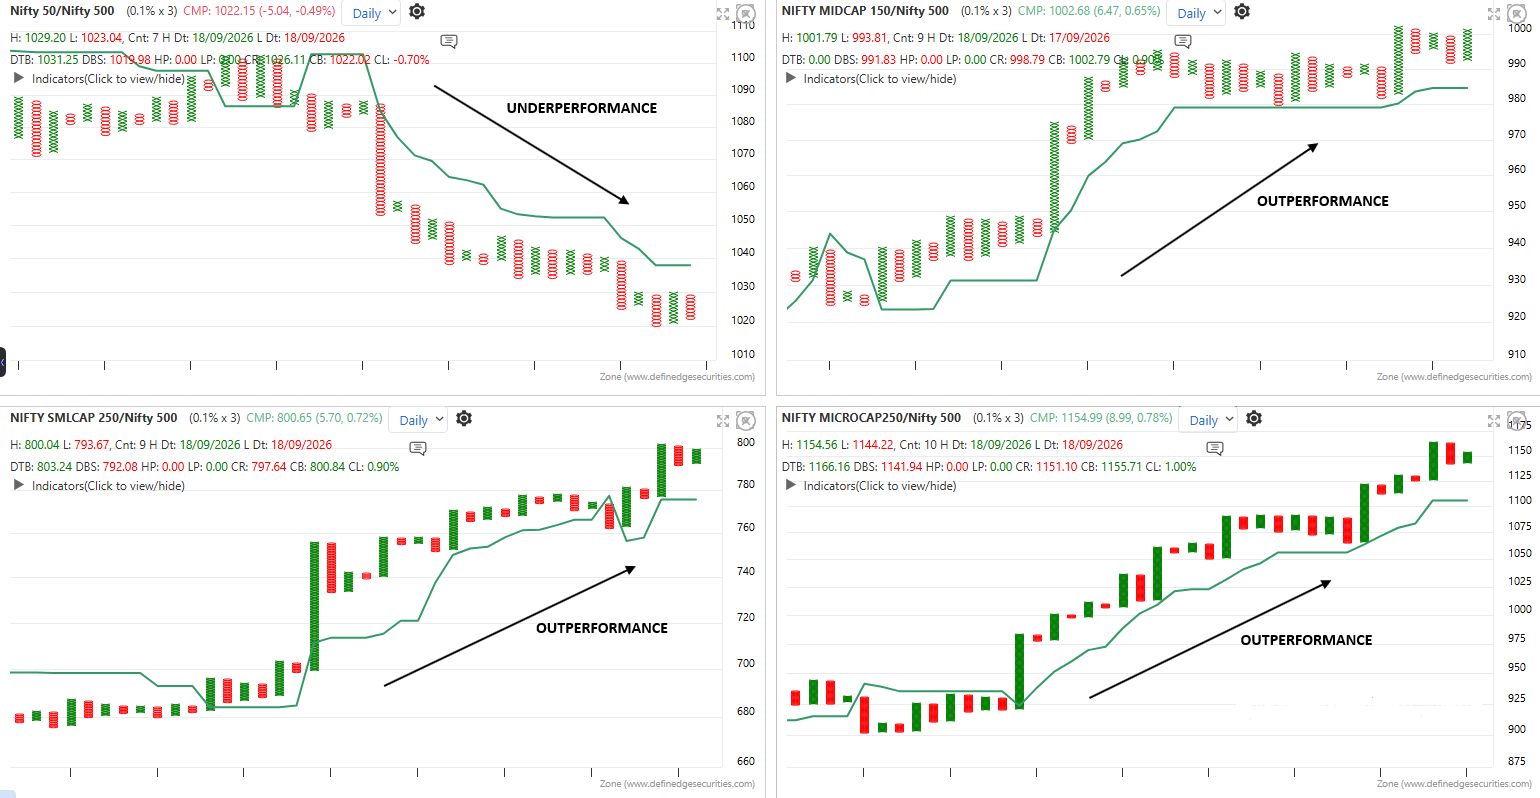
RELATIVE STRENGTH OF BROADER MARKET INDICES
Nifty 50 / Nifty 500 (Top-Left Chart)
The RS chart of Nifty 50 vs Nifty 500 continues to trade in a downtrend, showing that large-cap stocks are still underperforming the broader market. The ratio remains weak, with no meaningful improvement in relative strength visible yet.
Nifty Midcap 150 / Nifty 500 (Top-Right Chart)
The Nifty Midcap 150 vs Nifty 500 RS chart continues to indicate outperformance. After the earlier breakout, the ratio has seen some cooling in momentum but continues to remain in a positive setup.
The Nifty Smallcap 250 vs Nifty 500 ratio continues to remain strong and is showing outperformance. The recent bullish columns and movement near the highs indicate that relative strength continues to favour the Smallcap segment.
The Nifty Microcap 250 vs Nifty 500 RS chart remains in an outperformance phase. The ratio has continued to move higher with follow-through, showing that Microcaps are maintaining their relative strength against the broader market.
Overall, Nifty Midcap 150, Smallcap 250 and Microcap 250 continue to outperform the Nifty 500, while Nifty 50 remains in an underperformance phase. The broader market continues to show stronger relative performance, with Midcap, Smallcap and Microcap segments maintaining their strength
Sectors On Radar
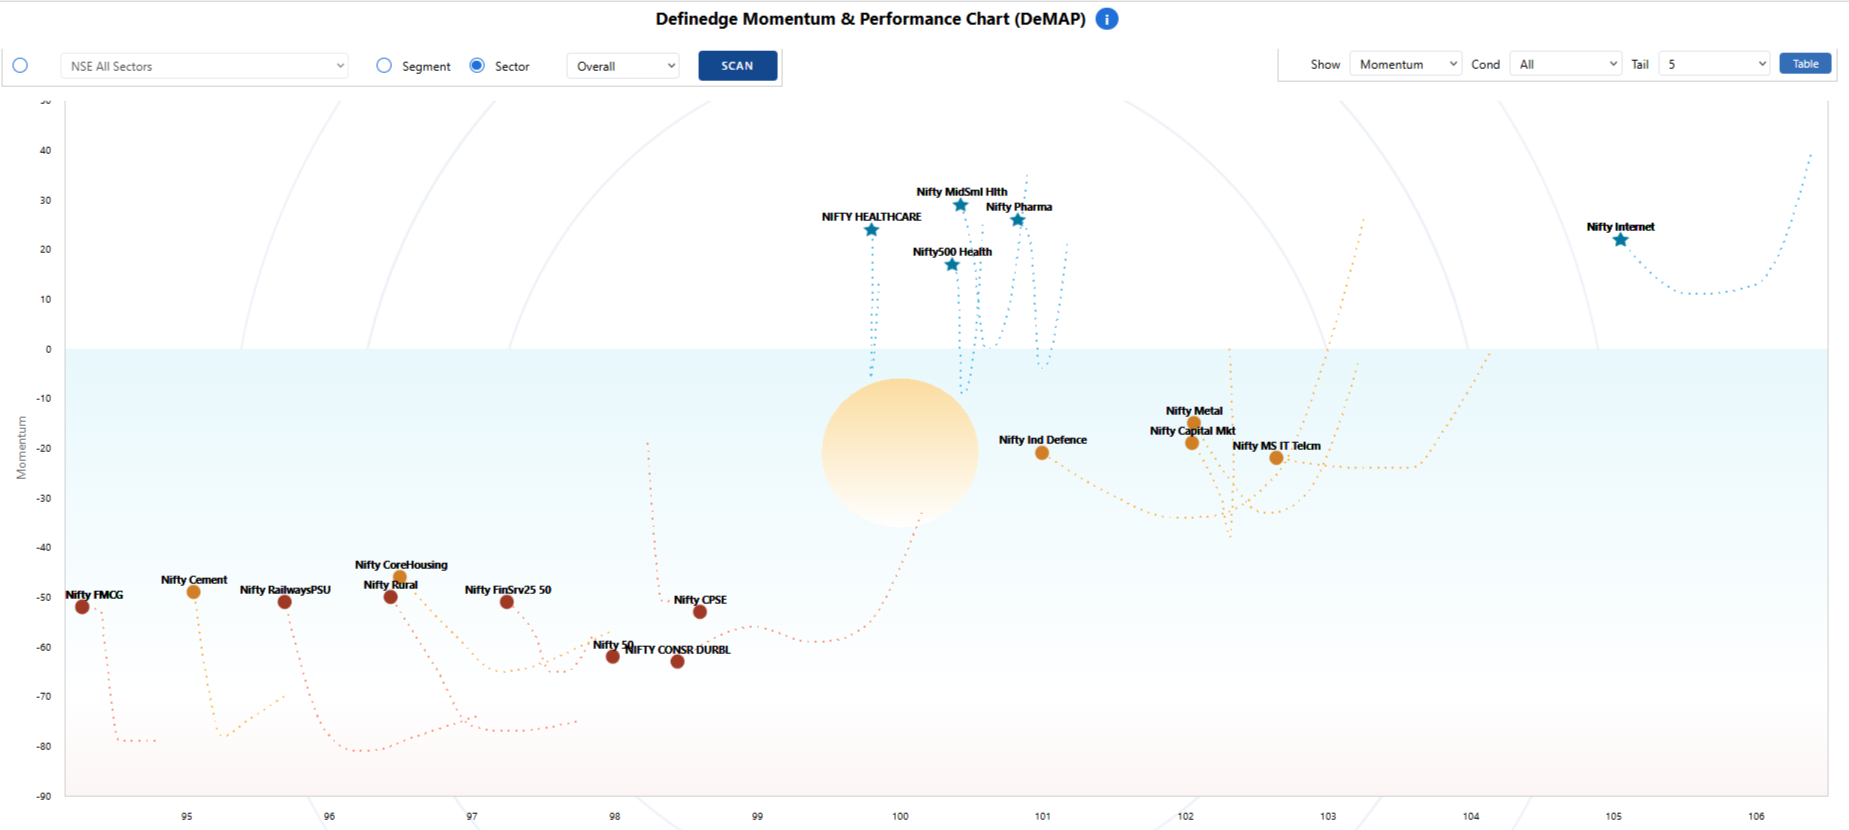
DEFINEDGE MOMENTUM AND PERFORMANCE CHART
Definedge Momentum and Performance (DeMAP) is a unique study developed by Definedge that helps you analyse the market at a glance. It combines price analysis, momentum, trend-following indicators, oscillators, Relative Strength,
Dynamic Relative Strength and other popular market factors to calculate Momentum and Performance levels.
DeMAP is divided into two zones, Sky and Water. Stocks above the zero line are in the Sky and shown as Stars, while those below are in the Water and shown as Circles. Green Stars indicate strong bullish momentum, Blue Stars semibullish, Red Circles bearish and Orange Circles semi-bearish.
The circle in each chart acts like a Sun, with its position indicating the sector's stance left for bullish, middle for neutral
In the Tradepoint and Zone web terminals, we have developed a scanner called the Eagle scanner. It considers the price setup on multiple timeframes, relative strength, matrix scores and pattern counter scores before scoring the stock.
Below are the top 15 stocks in the Nifty 500 index based on the Eagle score.
In RZone, we have developed a scanner that evaluates both P&F Price and Relative Strength (RS) charts. It allows you to combine price patterns with RS conditions to identify stocks that are showing a bullish/bearish price setup along with relative outperformance/Underperformance.
We also cover this pattern and the process of identifying such stocks in our weekly “Market Kya Lagta Hai” (MKLH) video.
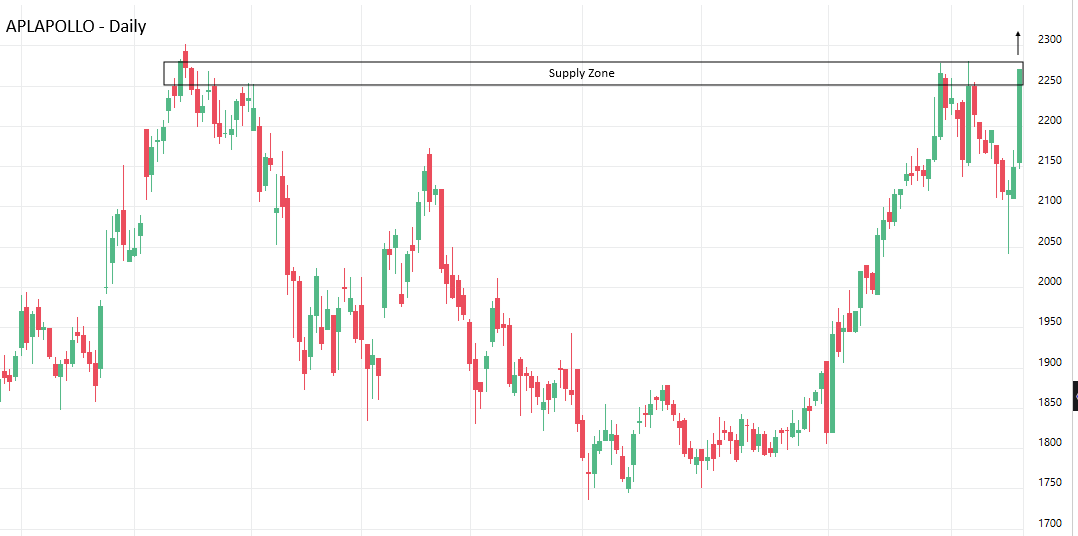
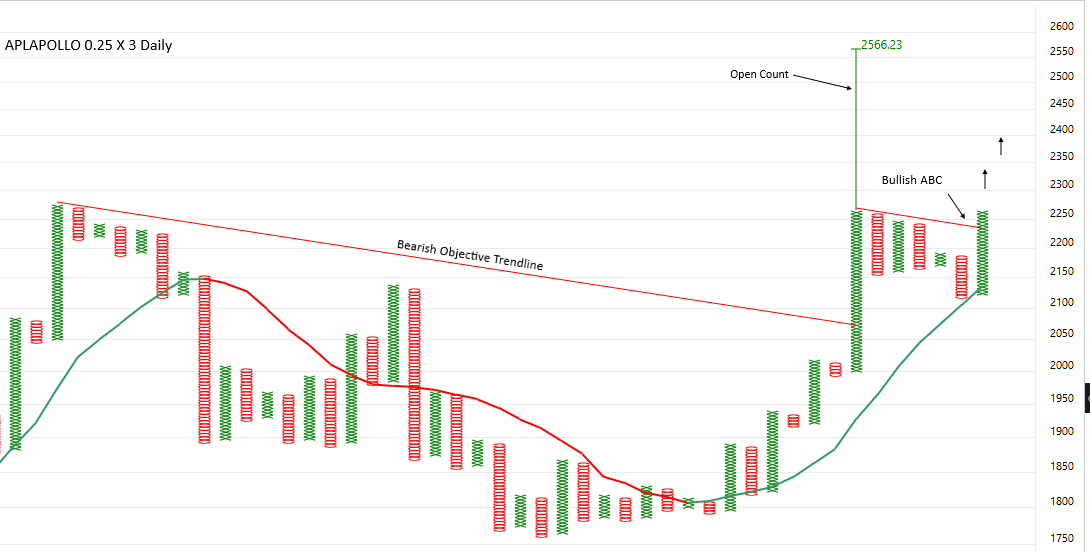
APL Apollo has seen a strong up move on the daily chart, rallying from the ₹1,800 zone to around ₹2,250–2,300. After this sharp rise, the stock is now facing resistance at its previous supply zone of ₹2,200–2,270, which had earlier capped the price on the way down. The Point & Figure chart (0.25% × 3) shows the stock breaking out of a Bearish Objective Trendline and forming a Bullish ABC pattern, confirming the shift in trend. The Open Count on the P&F chart gives a potential upside target of ₹2,566.
The stock has also reclaimed its old supply zone, and a sustained move above ₹2,270 would confirm the breakout, adding conviction to the setup and supporting continuation of the uptrend towards the ₹2,566 Open Count.
KPIL
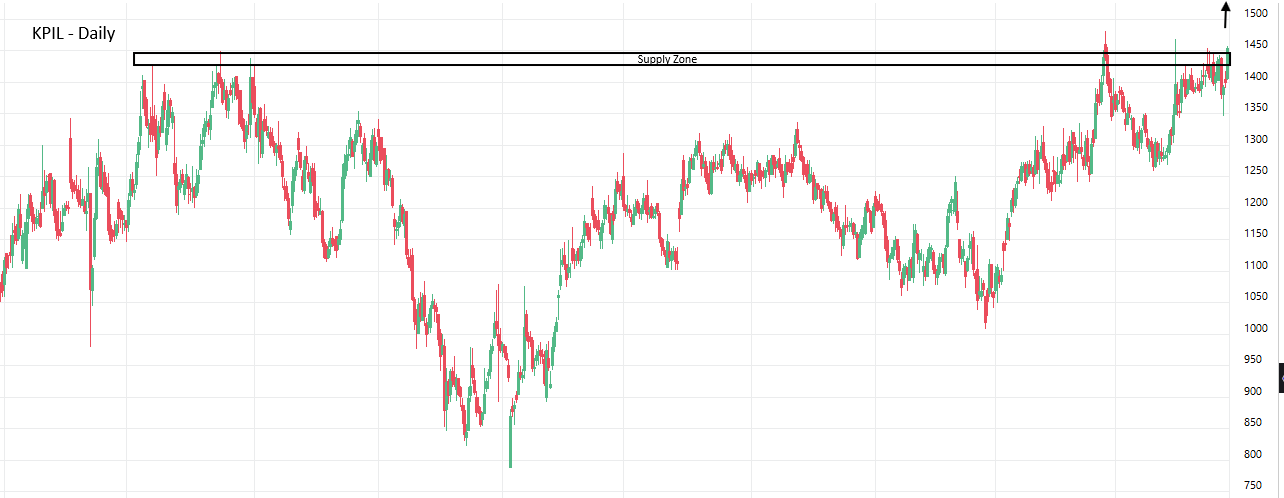
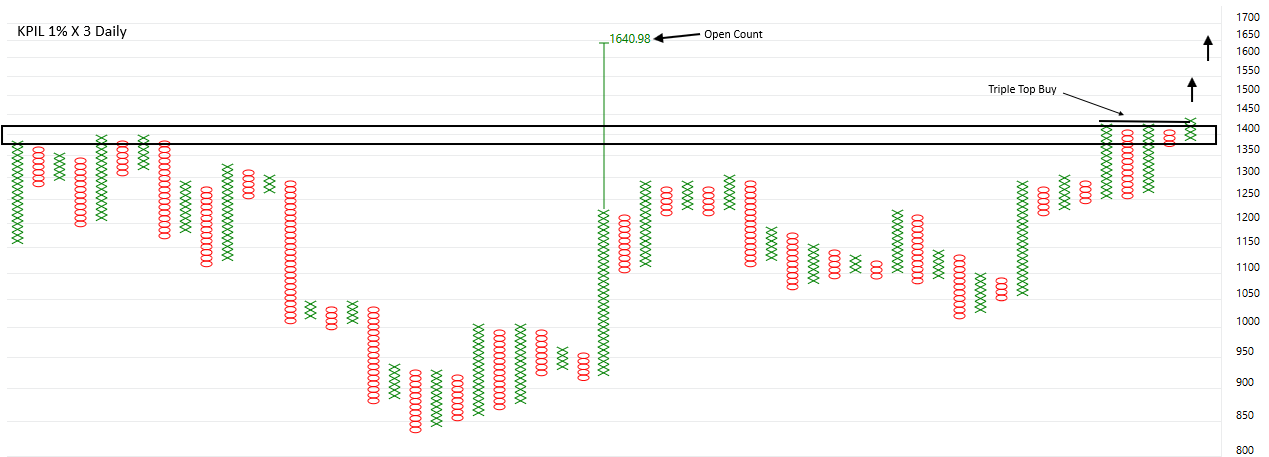
KPIL has seen a strong up move on the daily chart, rallying from the ₹1050 zone to around ₹1,400. After this sharp rise, the stock is now consolidating in the ₹1,350–1,450 range, which can be seen as a pause after the up move and coincides with an overhead supply zone. The Point & Figure chart (1% × 3) also shows a similar move followed by consolidation. The Open Count on the P&F chart gives a potential upside target of ₹1,640.
The stock has also given a Triple Top Buy breakout on the P&F chart, indicating that the current consolidation may be resolving to the upside. A sustained move above the supply zone would further strengthen the setup and support continuation of the uptrend towards the ₹1,640 Open Count.
BAJAJAUTO
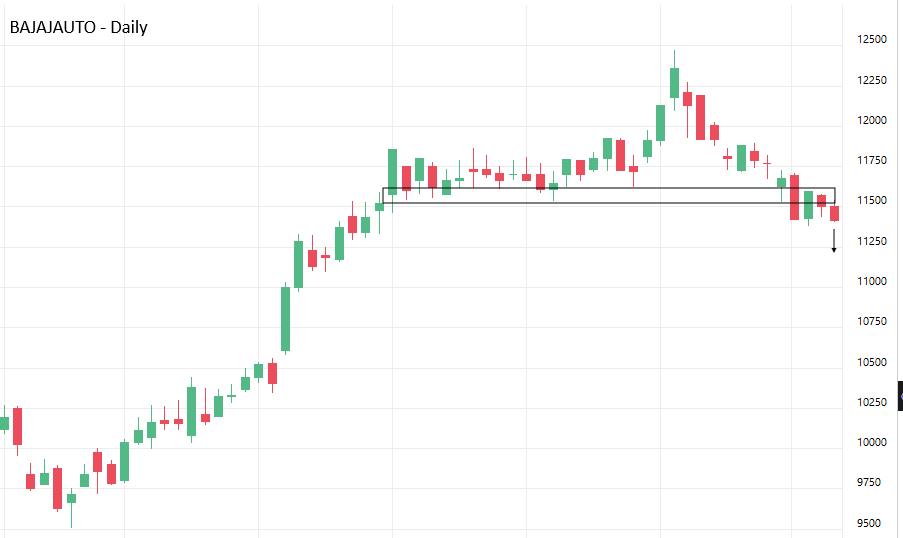
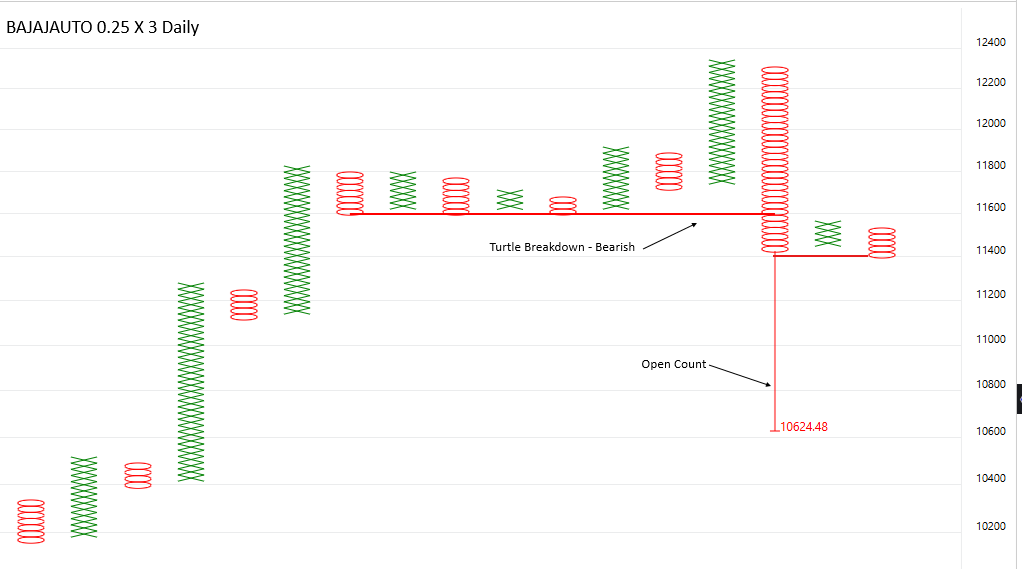
Bajaj Auto has seen a sharp up move on the daily chart, rallying from the ₹9,500 zone to a high of around ₹12,500. After this strong rise, the stock has turned weak and is now slipping below its recent consolidation support of ₹11,500, which had earlier acted as a base during the up move. The Point & Figure chart (0.25% × 3) also confirms this weakness, showing a Turtle Breakdown as the stock broke below its prior support column. The Open Count on the P&F chart gives a potential downside target of ₹10,624.
The stock has also failed to hold its consolidation range and is now trading with a negative bias. A sustained move below ₹11,400 would further confirm the breakdown, adding conviction to the setup and supporting continuation of the down move towards the ₹10,624 Open Count target.
Pack Your Bags: The Nifty India Tourism Index Is Taking-off
India’s holiday calendar is changing the way Indians travel. The traditional idea of taking one big annual vacation is gradually giving way to multiple short breaks, festival holidays, long weekends, winter getaways, destination weddings, family trips and year-end vacations. And the period from September to March is interesting for the travel and tourism ecosystem.
For the stock market, this creates an interesting seasonal theme for Nifty India Tourism.
Can the next six months turn the holiday mood into a market opportunity? September to March: India’s Great Holiday Window
For India, September marks the beginning of a particularly interesting travel period. The monsoon starts retreating
across large parts of the country, followed by Navratri, Dussehra, Diwali, Christmas, New Year, winter vacations,
Republic Day and multiple long weekends. Add destination weddings, family functions and religious travel, and the calendar becomes packed with reasons to travel.
This is also visible in India's broader tourism numbers. The Ministry of Tourism said India experienced around 4.29 billion domestic tourist visits in 2025, up 45.6% from 2024. The arrival of foreign tourists reached 25.27 million, also a strong gain.
The Ministry’s data for 2025 also brings to the fore the magnitude of India’s domestic travel economy, with tourism’s direct and indirect contribution supporting millions of jobs.
But the stock market generally looks forward. That is where the Nifty India Tourism chart becomes interesting.
Nifty India Tourism: A Rebound from Demand Zone
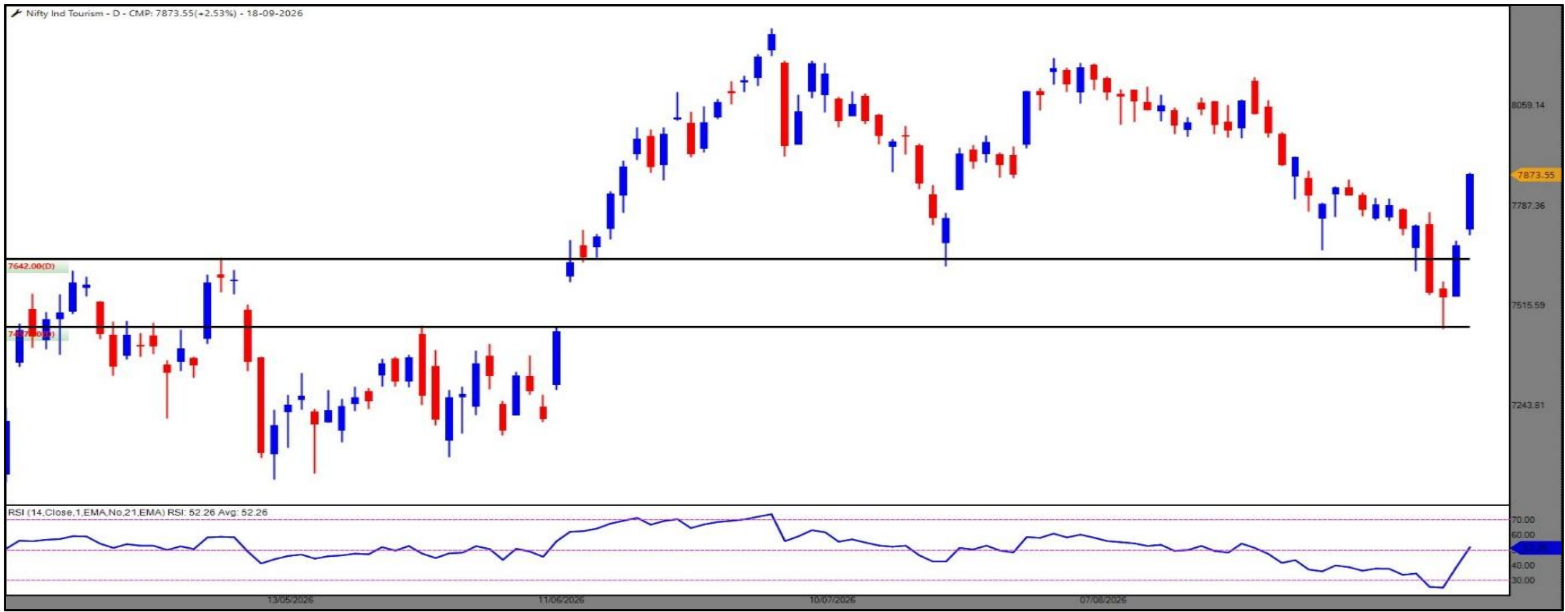
The index had previously moved into a strong uptrend and reached the 8,000–8,200 zone before entering a corrective phase. The subsequent decline brought the index towards the 7,450–7,640 region, where buyers have started appearing.
7,457-7,462 — This level acted as an important support area during the earlier price structure. The recent decline once again brought the index close to this zone. The sharp rejection from the lower levels suggests that buyers were willing to defend the area.
The next technical challenge is therefore around the previous swing zones near 7,900–8,050, followed by the earlier high area.
The 14-period RSI shown below the chart is around 52.26. This is significant because RSI has recovered sharply from the oversold region.
Rather than being excessively overbought, the indicator has moved back above the neutral 50 zone.
All Chart Matrix: Where Are the Leaders?
Technical analysis becomes more useful when the index chart is combined with constituent-level analysis.
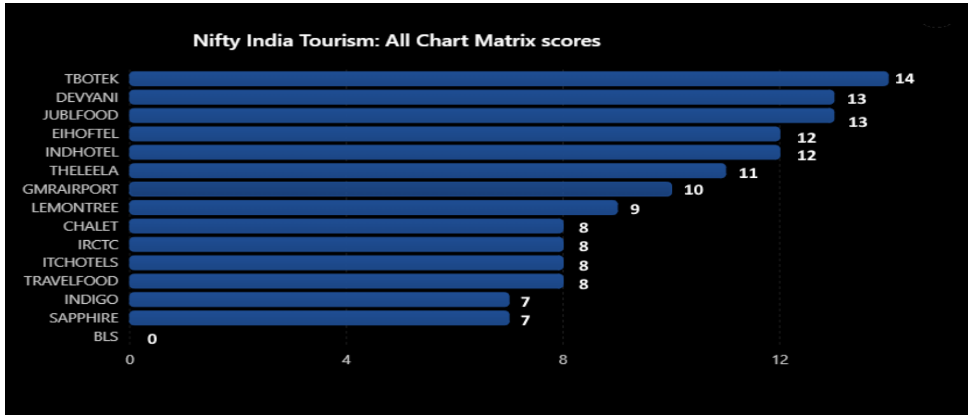
The All Chart Matrix provided with the analysis assigns a Total Score to individual tourism-related stocks. The matrix shared here contains 15 stocks.
The index may be moving, but not every constituent is moving with the same technical strength.
That is precisely why a matrix-based approach can be useful. Instead of looking only at the index, traders can identify where the underlying technical strength is concentrated.
A high score does not automatically mean a stock will outperform. Rather, it indicates that, according to the scoring framework used in the supplied matrix, those stocks currently have stronger combined chart characteristics.
Follow the Holiday Money
The September-to-March period could create multiple waves of travel demand rather than one single event. Think about the sequence:
September–October: Festivals, Navratri, Dussehra and improving post-monsoon travel conditions.
October–November: Diwali, family travel, weddings and extended breaks.
December: Christmas, winter holidays and year-end vacations.
January: New Year travel followed by winter tourism.
February–March: Weddings, spring travel and school/college vacation planning.
This makes tourism different from a single-event theme. It can potentially receive multiple demand triggers across six consecutive months. And that is where the stock market's forward-looking nature becomes interesting.
India's holiday culture is becoming an economic theme. From festivals to flights, hotels to restaurants, railways to travel services, every holiday creates a chain of consumption.
So, as India enters its long holiday window, investors may want to keep the Nifty India Tourism Index on the radar.
Sometimes, the next market theme does not begin in a boardroom. It begins with a suitcase.
FII — DII Activityy
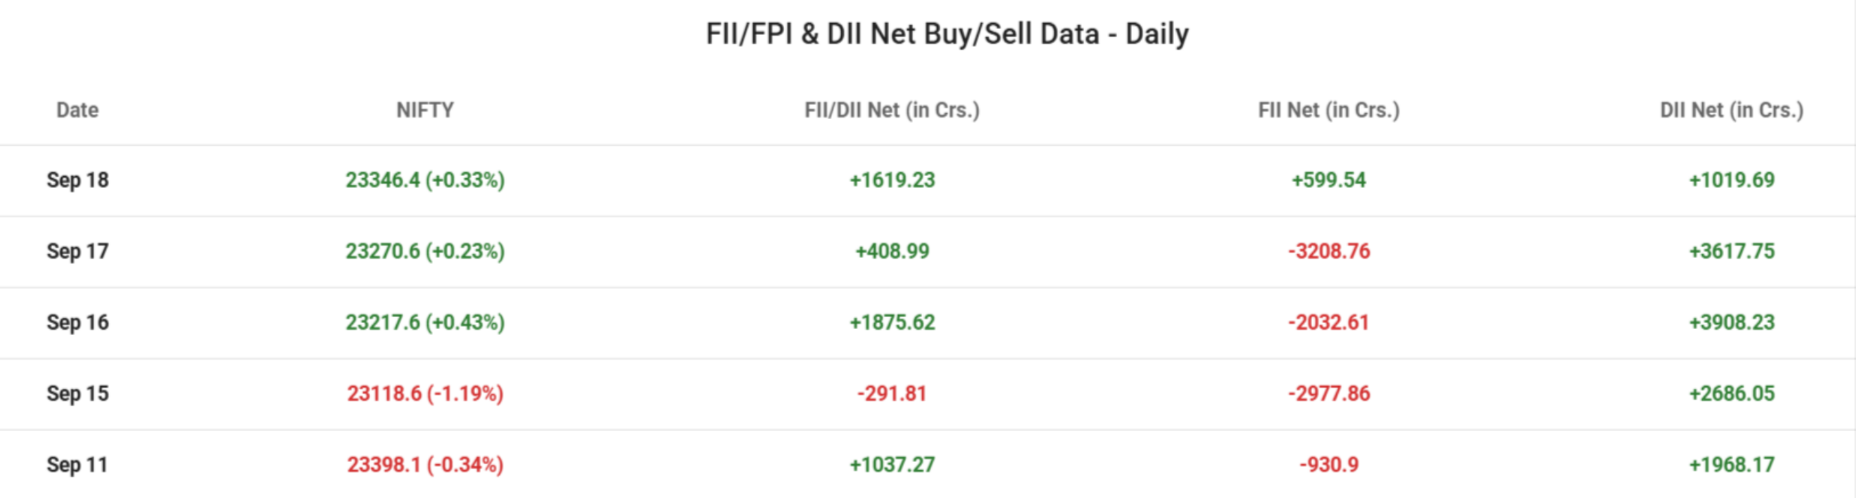
Foreign investors turned decisively cautious during the week, with FIIs recording net selling on four of the five trading sessions. FIIs were marginal buyers on Thursday, purchasing around ₹600 crore, but selling intensified over the following sessions, with net outflows of around ₹3,209 crore on Wednesday, ₹2,033 crore on Tuesday, ₹2,978 crore on Monday and ₹931 crore on Friday. Overall, FIIs were net sellers of around ₹8,551 crore during the week.
Domestic institutions, meanwhile, remained strongly supportive of the market. DIIs recorded net buying across all five trading sessions, with purchases of around ₹1,020 crore on Thursday, ₹3,618 crore on Wednesday, ₹3,908 crore on Tuesday, ₹2,686 crore on Monday and ₹1,968 crore on Friday. Overall, DIIs were net buyers of around ₹13,200 crore during the week.
Overall, the week saw a clear divergence between FII and DII flows. FIIs were heavy net sellers, while DIIs consistently absorbed the selling pressure with strong buying. Despite the significant FII outflows, the Nifty remained relatively stable, moving from 23,398.10 on Sep 11 to 23,346.40 on Sep 18, a decline of only around 0.22% for the week. Strong DII participation therefore provided an important cushion against sustained foreign selling pressure
FII, PRO & CLIENT POSITIONING – WEEKLY VIEW
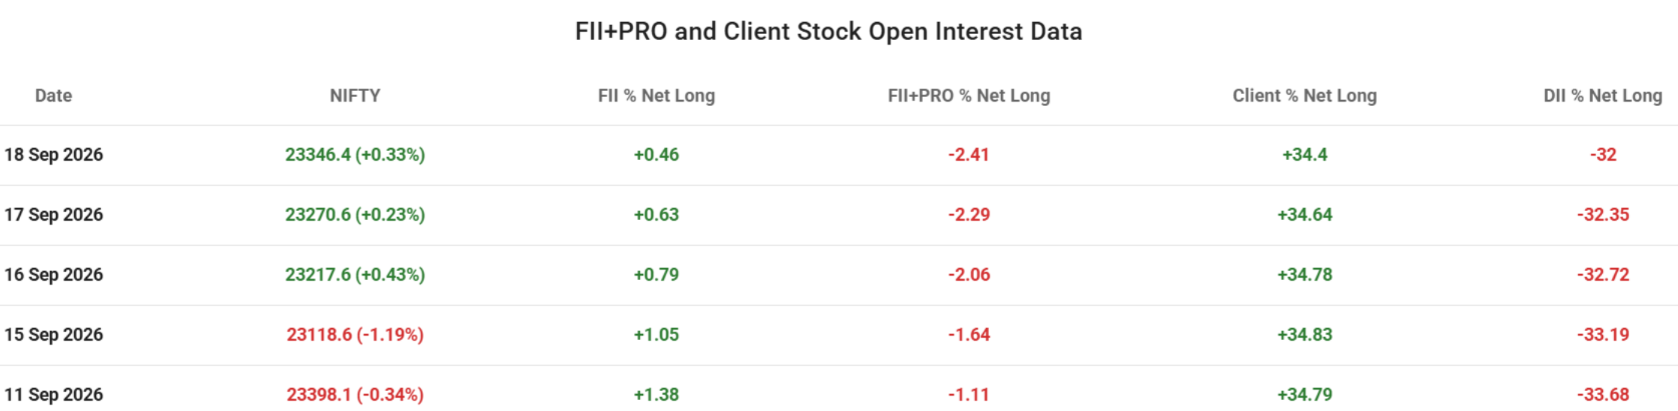
During the week, Nifty remained largely range-bound with a cautious undertone and closed at 23,346.40 on Friday, 18 Sep, compared with 23,398.10 on Friday, 11 Sep, resulting in a marginal weekly decline of around 0.22%. The index witnessed some volatility during the week, with a sharp decline on Monday followed by a recovery over the subsequent sessions.
FII positioning weakened during the week, with FII % Net Long declining from +1.38% on 11 Sep to +0.46% on 18 Sep. Although FIIs remained marginally net long, the decline in long exposure indicates that their bullish positioning moderated, reflecting a more cautious stance.
The FII+PRO % Net Long also deteriorated significantly, moving from -1.11% on 11 Sep to -2.41% by 18 Sep. This indicates that the combined positioning of FIIs and professional traders became more bearish during the week, with their net long exposure moving further into negative territory.
Client positioning remained strongly bullish, although it moderated slightly. Client % Net Long declined from +34.79% to +34.40%, remaining close to the 35% level throughout the week. This suggests that clients continued to maintain a strong bullish bias despite the lack of significant upward movement in Nifty.
On the other hand, DII % Net Long remained negative but improved from -33.68% to -32.00%. This indicates that domestic institutional positioning became slightly less defensive during the week, although it continued to remain firmly in negative territory.
Overall, FII positioning weakened during the week, while FII+PRO positioning deteriorated further into negative territory, indicating increasing caution among foreign and professional traders. Clients continued to maintain a strong bullish stance, whereas DIIs remained defensive despite a modest improvement in positioning. With Nifty declining marginally and professional trader positioning weakening, overall market sentiment remained cautious during the week.
Future Open Interest Buildup
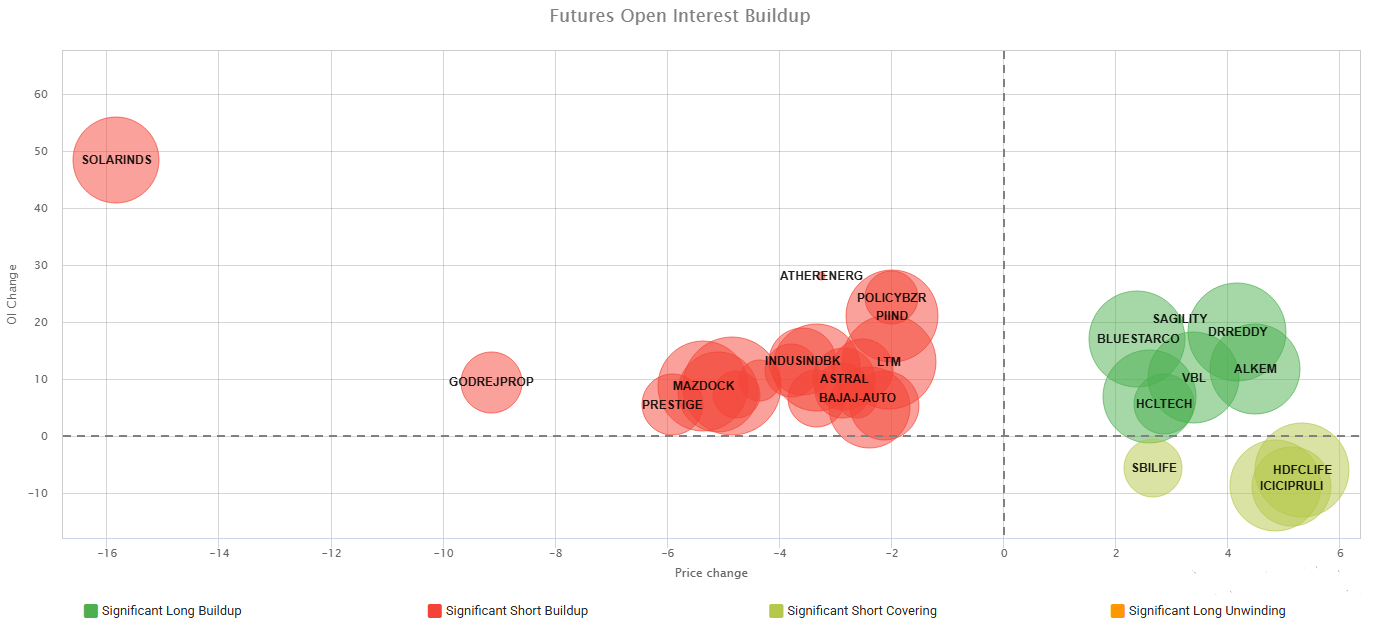
The futures market showed a mixed tone this week, with significant short buildup dominating across several stocks, while fresh long buildup and short covering were also visible in select counters.
Stocks such as Solar Industries, Godrej Properties, Ather Energy, Polycab, Pidilite, IndusInd Bank, Astral, LTM, Bajaj Auto, Mazagon Dock, Prestige Estates, and other counters witnessed falling prices along with rising Open Interest, indicating
fresh short positions.
On the positive side, Blue Star, Sagility, Dr. Reddy’s, VBL, Alkem, and HCL Tech saw rising prices and increasing Open Interest, pointing to fresh long buildup.
Meanwhile, SBI Life, HDFC Life, and ICICI Prudential Life witnessed short covering, as prices rose while Open Interest declined.
There was no significant long unwinding visible in the chart this week.
The size of each bubble represents the stock's Volume Percentile, with larger bubbles highlighting stocks that witnessed unusually high futures trading activity compared with the past year.
Overall, short buildup remained the dominant theme, with fresh short positions visible across several stocks. At the same time, long buildup in select stocks and short covering in the insurance sector indicate pockets of strength within an otherwise mixed futures setup.
Stocks in Action
Mutual fund portfolio disclosures are often analysed at the sector level, they can also be studied stock-by-stock to understand which individual companies institutional investors are adding to or trimming from their portfolios. This offers a more granular view than sector-level trends, helping investors spot specific stocks that are seeing a meaningful shift in mutual fund ownership.
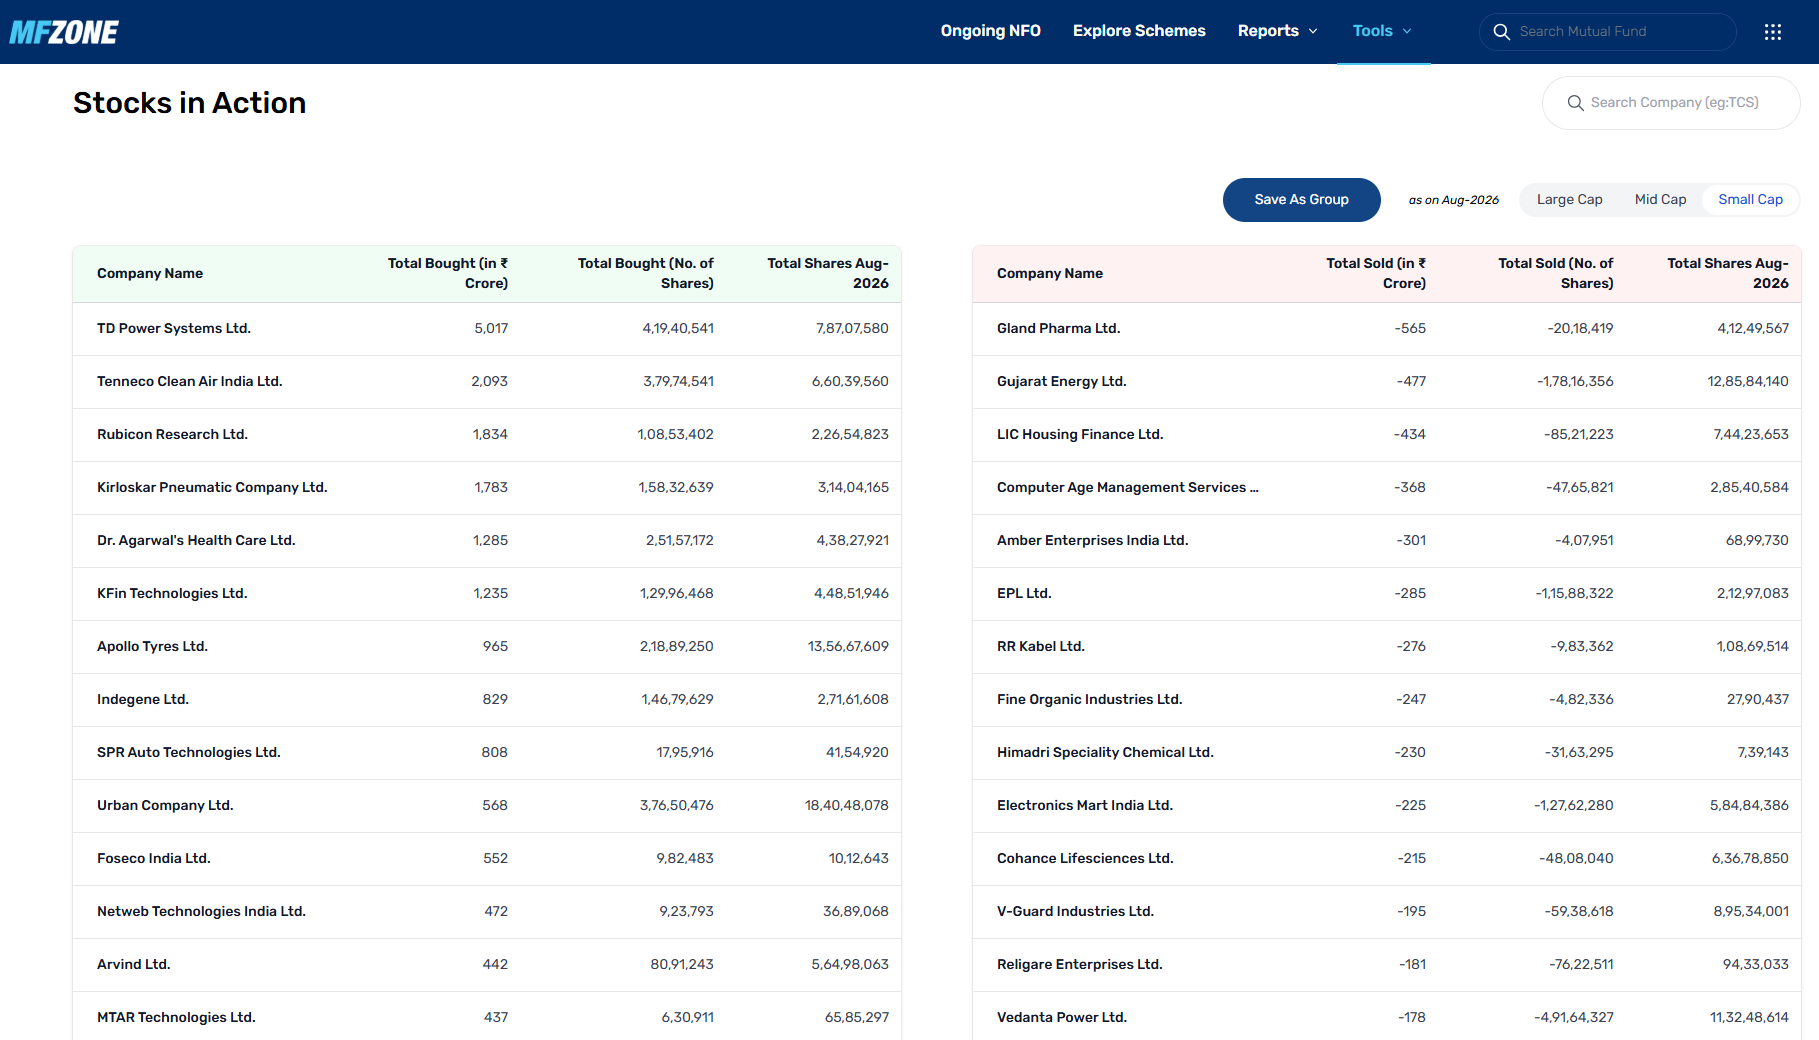
The Stocks in Action tool on MFZone captures this by showing the total value and number of shares bought and sold by mutual funds for individual stocks during the month, along with the total shares held as of month-end. This makes it easy to see which stocks are attracting fresh institutional buying and which are witnessing sustained selling.
For August, Tenneco Clean Air India, Rubicon Research and Dr. Agarwal Health Care were among the stocks that saw the highest mutual fund buying by value. On the other hand, Gland Pharma, Gujarat Energy and LIC Housing Finance witnessed the highest selling during the month.
As with sector-level data, stock-level buying and selling activity should be read alongside company fundamentals, earnings outlook, and valuations before drawing investment conclusions.
Note: TD Power Systems and Kirloskar Pneumatic Company underwent a 2:1 stock split during the month. As a result, the buy/sell figures for these two stocks are distorted by the split and should be ignored for this month's data
NIFTY NEXT 100 INDEX
The National Stock Exchange has been extremely active in launching new indices on a regular basis. The recently launched indices of interest are Nifty AI Catalysts and the Nifty Next 100.
The Nifty AI Catalysts Index tracks the performance of companies that provide critical products, services, and infrastructure that enable the AI ecosystem. The index covers key AI enabling groups such as computing, and IT infrastructure, connectivity, power and electrification, cooling systems, engineering and construction, and associated cables and materials. The weight of each stock in the index is based on its free-float market capitalization with a stock cap of 3%.
We shall focus on the other one, the Nifty Next 100 index. The Nifty Next 100 aims to track the performance of a 100-stock portfolio constructed by selecting 50 stocks from Nifty Next 50 and top 50 stocks from Nifty Midcap 150, based on their 6-month Avg. Free-float market Capitalization.
Unfortunately, both these indices are updated on an EOD basis. Hence most data vendors might not offer these indices in their charting platform. The Nifty Next 100 index appears to be an interesting one, capturing an interesting mix of large and midcap stocks. It eliminates ultra large cap stocks and includes the cream of the mid cap ones.
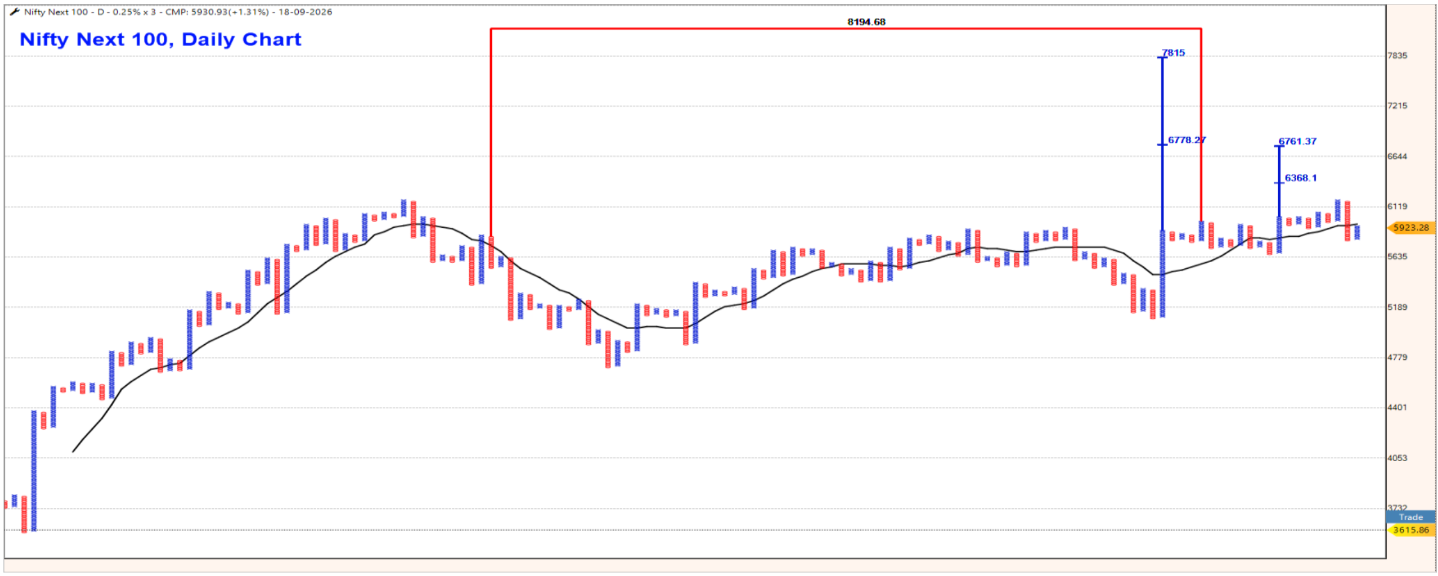
Here is the daily chart of the Nifty Next 100 index. The data for this chart was downloaded from the official NSE website.
The index has been in a prolonged period of consolidation / correction and appears set to resume its uptrend. There are open vertical and horizontal counts pointing to targets of 6,700-6,800 and 7,800-8,200.
Keep an eye on this interesting index. It is a recently launched and there are no ETFs or index funds to invest in it yet.
Wait for such offering and look to take exposures thereafter.