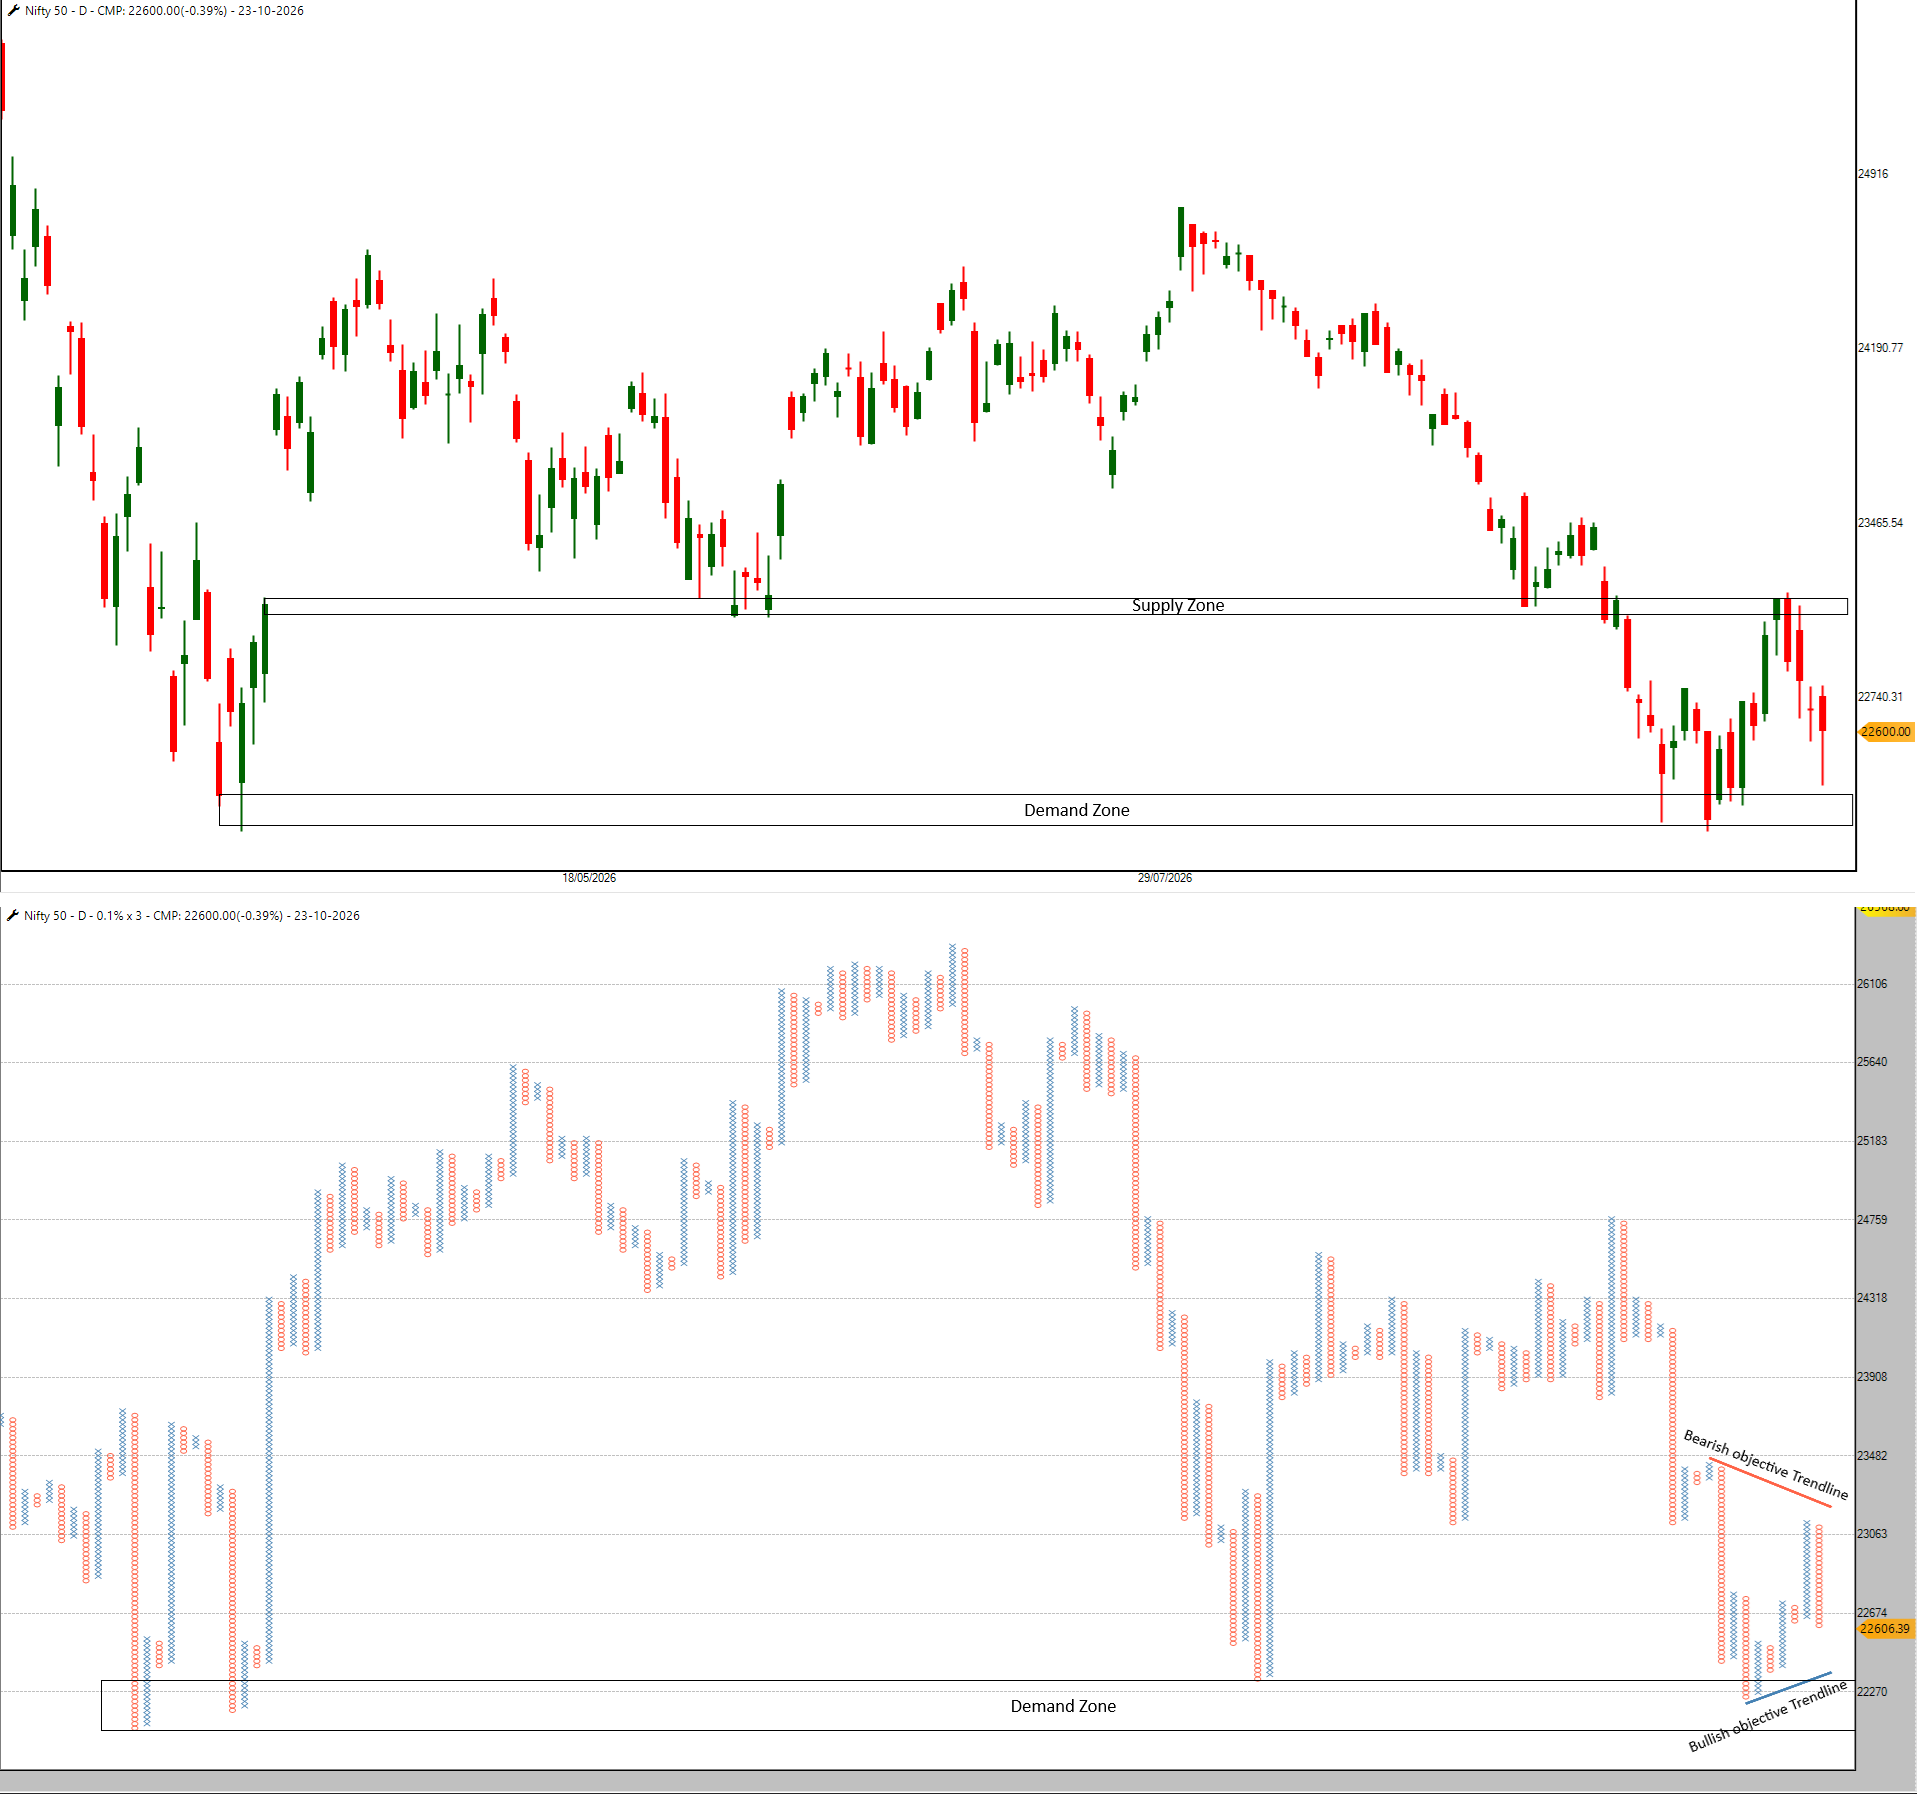
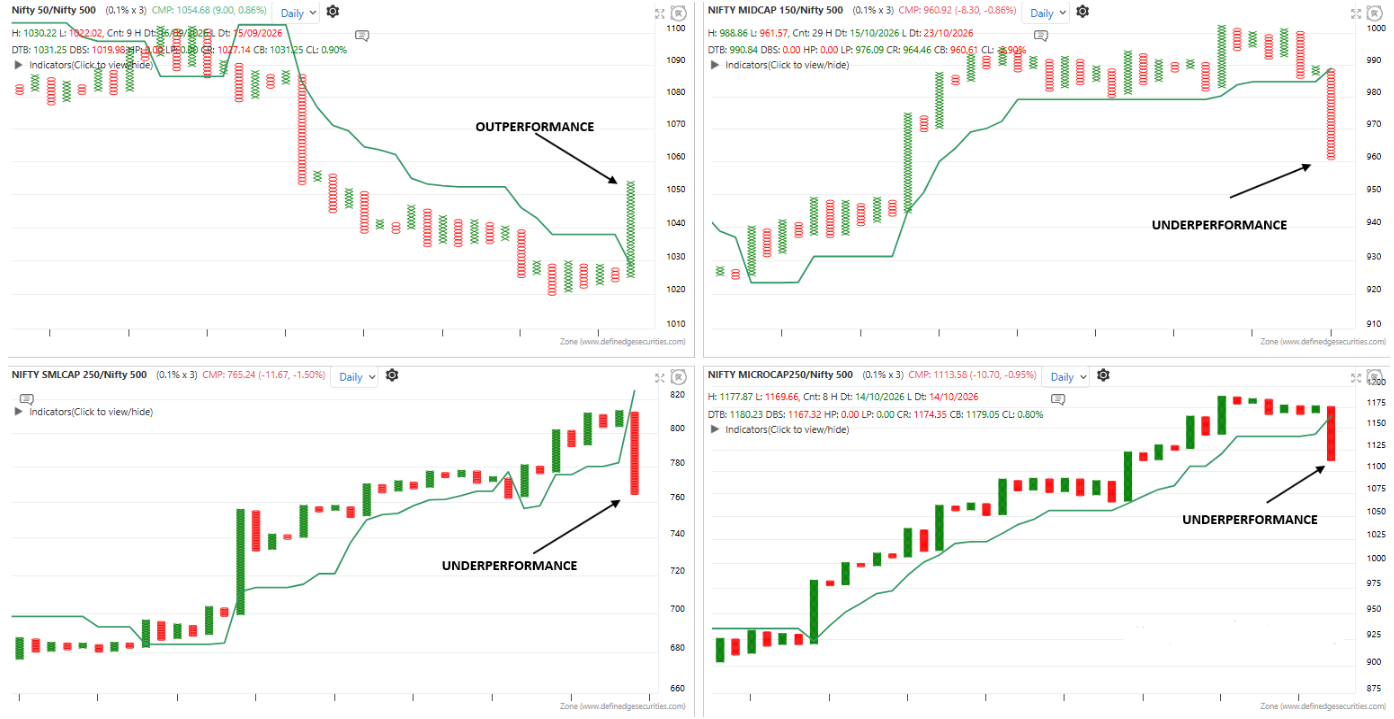
The market remained weak during the week. Out of the 53 NSE sectors, only IT ended higher, gaining just 0.22%. The Nifty Midcap 150 fell 5.27%, while the Nifty Smallcap 250 and Nifty Microcap 250 declined by around 7% each. Both the Midcap 150 and Smallcap 250 are now more than 10% below their recent highs.Nifty is trading in a broad range between support at 22,150 to 22,300 and resistance at 23,000 to 23,150. A clear move outside this range could determine the next direction. The support area has been tested several times, making it important to monitor. A sustained break below 22,150 could lead to further weakness towards 22,000 to 21,750.
BANKNIFTY SHORT TERM VIEW
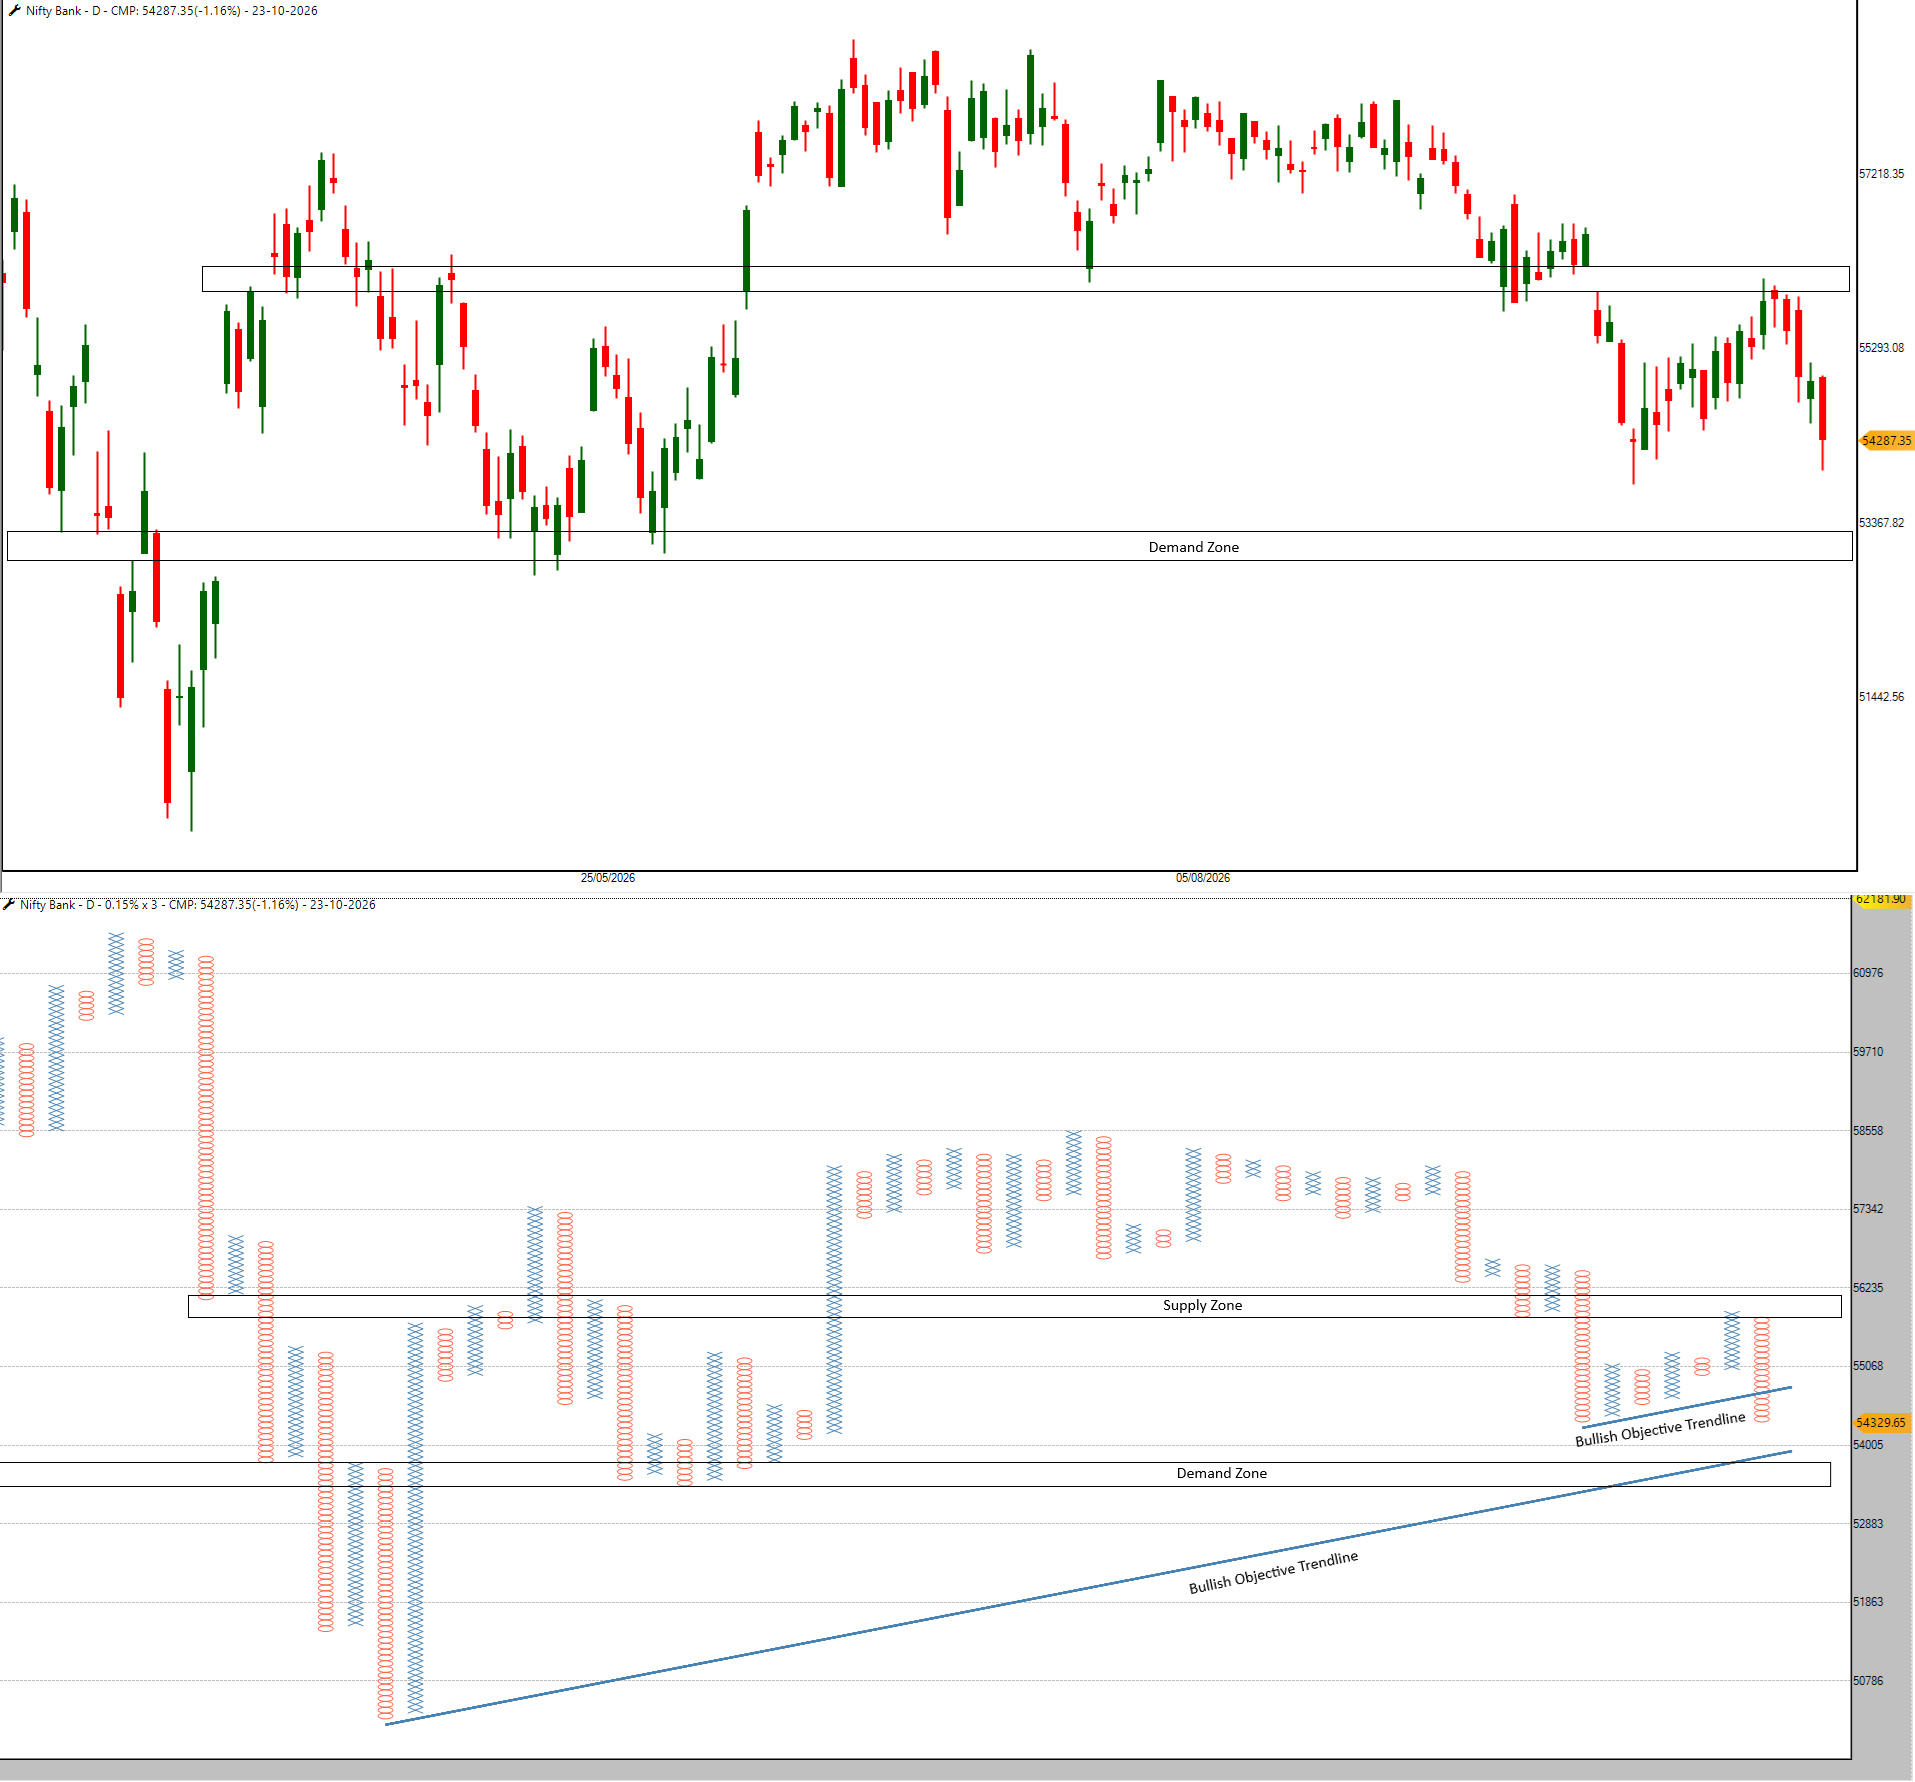
Bank Nifty also remained under pressure, with 10 of its 14 constituents ending the week lower. Kotak Bank, AU Bank and IDFC First Bank are scheduled to announce results on Saturday.On the technical chart, Bank Nifty is trading below its Bullish Objective Trendline. As highlighted in the previous two newsletters, the next important support is at 53,500 to 53,700, where another Bullish Objective Trendline is placed. This makes the zone important to watch for a possible recovery. Immediate resistance is at 55,950 to 56,200.
Market Breadth
NIFTY 500 MARKET BREADTH
P&F X% Breadth
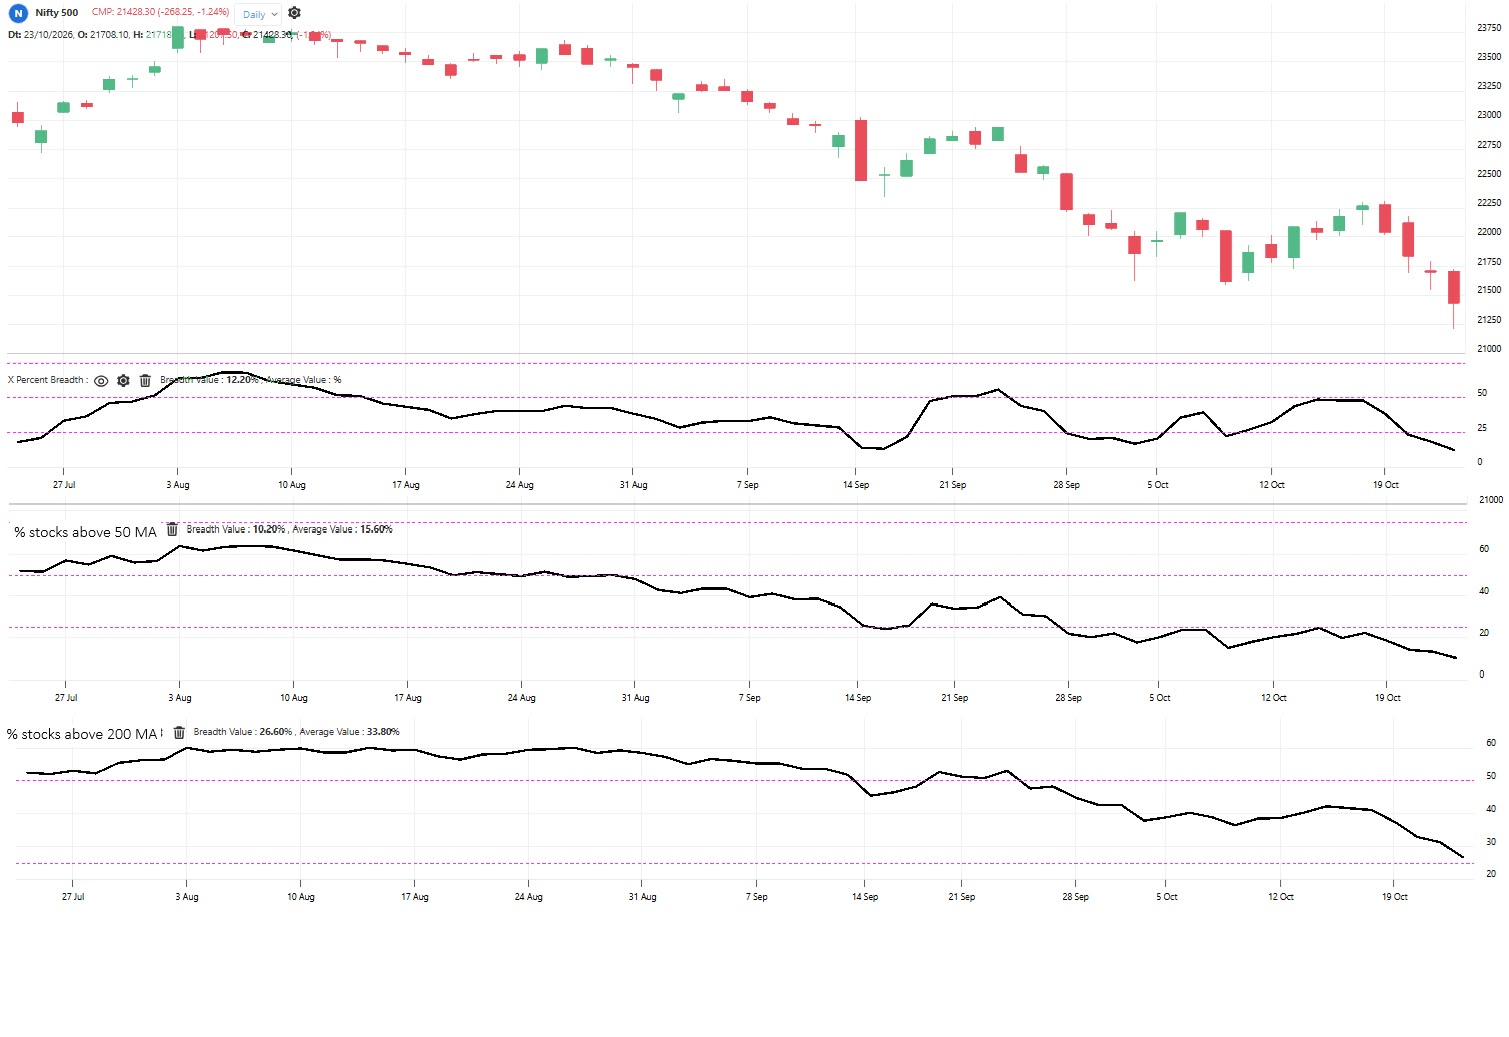
The P&F X% Breadth indicator has fallen sharply from 48.00% last week to 12.20%. Only around 61 stocks are in a column of X. The indicator is now in the oversold zone, showing widespread short-term weakness.
Stocks Above 50-Day Moving Average
Only 10.20% of Nifty 500 stocks, or around 51 stocks, are trading above their 50-day moving average. This is down from 22.20% last week. The reading remains in the oversold zone and indicates weak medium-term participation.
Stocks Above 200-Day Moving Average
The percentage of stocks above their 200-day moving average has declined from 41.00% to 26.60%. Around 133 stocks remain above this average. With the reading well below 50%, long-term market participation is also weak.
All three breadth indicators have weakened compared with the previous week. The sharp fall in P&F X% Breadth shows strong short-term selling pressure, while the 50-day and 200-day readings confirm that weakness is widespread. Oversold conditions can lead to a temporary recovery, but a sustained improvement in breadth is needed to support a stronger market outlook.
RELATIVE STRENGTH OF MAJOR ASSET CLASSES:
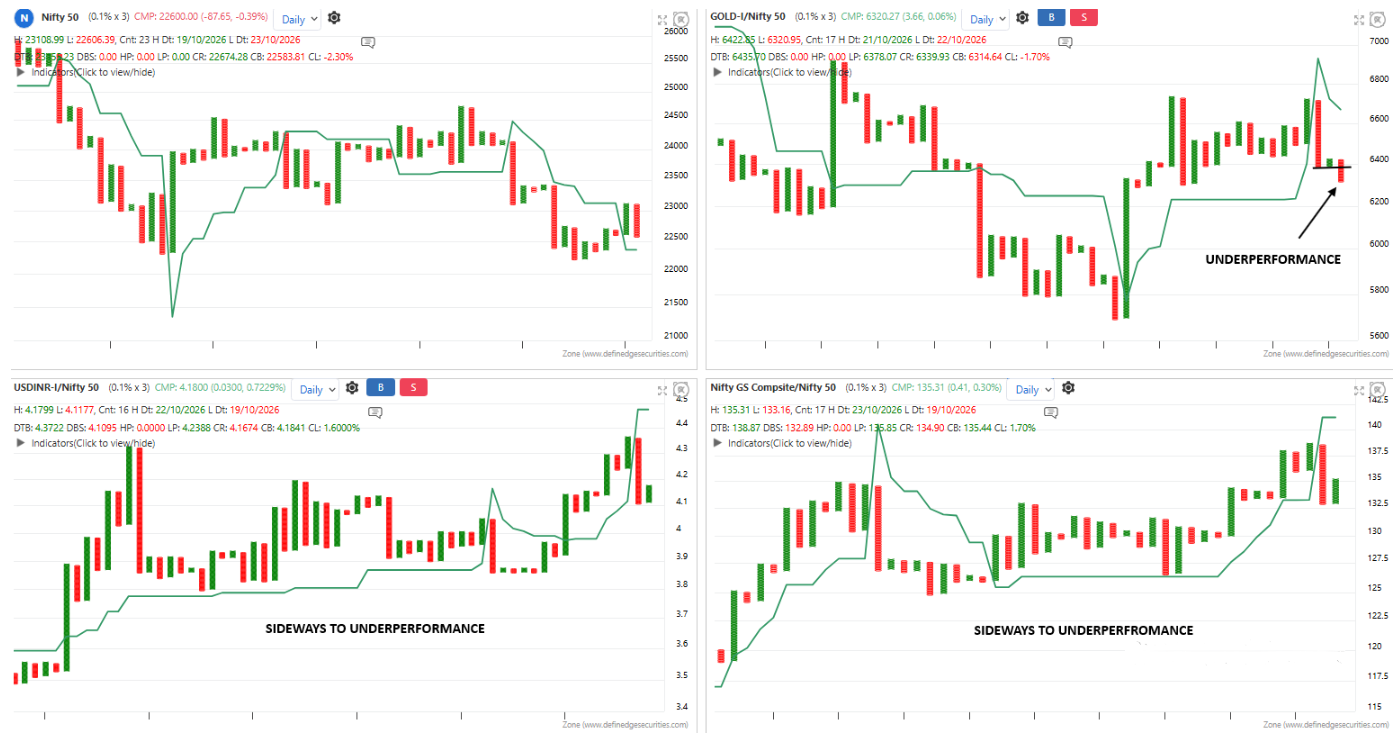
Nifty 50 (Top-Left Chart)Nifty 50 has reversed into a column of O but remains above the D-Smart line. A move below this line would weaken the setup. A fresh column of X would be an early sign of recovery. Nifty 50 X% Breadth has declined from 56% to 30%, showing weaker participation.
Gold vs Nifty 50 (Top-Right Chart)Gold is in a column of O and has moved below the D-Smart line on the relative performance chart. This indicates that Gold is underperforming Nifty 50. The setup favours equities on a relative basis for now. A move above the D-Smart line would indicate improving relative performance in Gold.
USDINR vs Nifty 50 (Bottom-Left Chart)USDINR remains below the D-Smart line on the relative performance chart, indicating underperformance against Nifty 50. Although the latest column has turned to X, the ratio is still below the trend line. A sustained move above the D-Smart line would be needed to improve the setup.
Nifty G-Sec Composite vs Nifty 50 (Bottom-Right Chart)The bond index is in a column of O and remains below the D-Smart line on the relative performance chart. This shows that bonds are underperforming Nifty 50. Further weakness in the ratio would support this view, while a move above the D-Smart line would suggest improvement in bonds.
RELATIVE STRENGTH OF BROADER MARKET INDICES
Nifty 50 vs Nifty 500 (Top-Left Chart)The relative performance chart has formed a strong upward column and moved above the D-Smart line. This indicates that Nifty 50 is performing better than the broader Nifty 500 index. A move above the recent resistance would strengthen the setup.
Nifty Midcap 150 vs Nifty 500 (Top-Right Chart)The relative performance chart has formed a long downward column and is trading below the D-Smart line. This shows that midcap stocks are underperforming Nifty 500. Further weakness would keep the outlook negative.
Nifty Smallcap 250 vs Nifty 500 (Bottom-Left Chart)The relative performance chart has formed a long downward column and moved below the D-Smart line. This suggests that smallcap stocks have lost their earlier strength compared with Nifty 500.
Nifty Microcap 250 vs Nifty 500 (Bottom-Right Chart)The relative performance chart has moved below the D-Smart line after a long period of outperformance. This indicates weakening momentum in microcap stocks. A move back above the D-Smart line would improve the setup.
Overall,Nifty 50 is now showing better relative performance than the broader market. Midcap, smallcap and microcap indices have weakened and moved below their D-Smart lines. The current setup suggests that largecap stocks are holding up better than the wider market.
Sectors On Radar
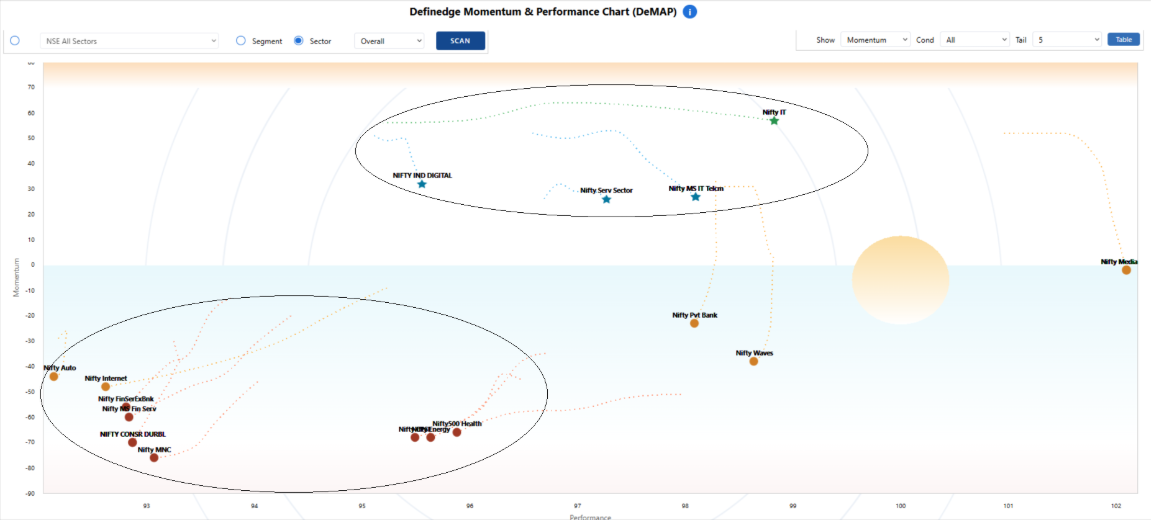
DEFINEDGE MOMENTUM AND PERFORMANCE CHART
Definedge Momentum and Performance (DeMAP) is a market analysis tool that brings several technical factors into one view. It uses price, momentum, trend, relative performance and other indicators to assess the strength of sectors and stocks.
DeMAP has two areas called Sky and Water. Stocks above the zero line appear as stars in the Sky, while those below it appear as circles in the Water. Green stars indicate strong bullish momentum, blue stars indicate moderate bullish momentum, red circles indicate bearish momentum and orange circles indicate moderate bearish momentum.
The Sun symbol provides a quick view of market direction. Its position towards the left indicates a bullish bias, the centre indicates a neutral bias and the right indicates a bearish bias.
DEMAP
Strong sectors: Nifty MS IT Telcm, Nifty IT, Nifty IND Digital , Nifty Serv Sector
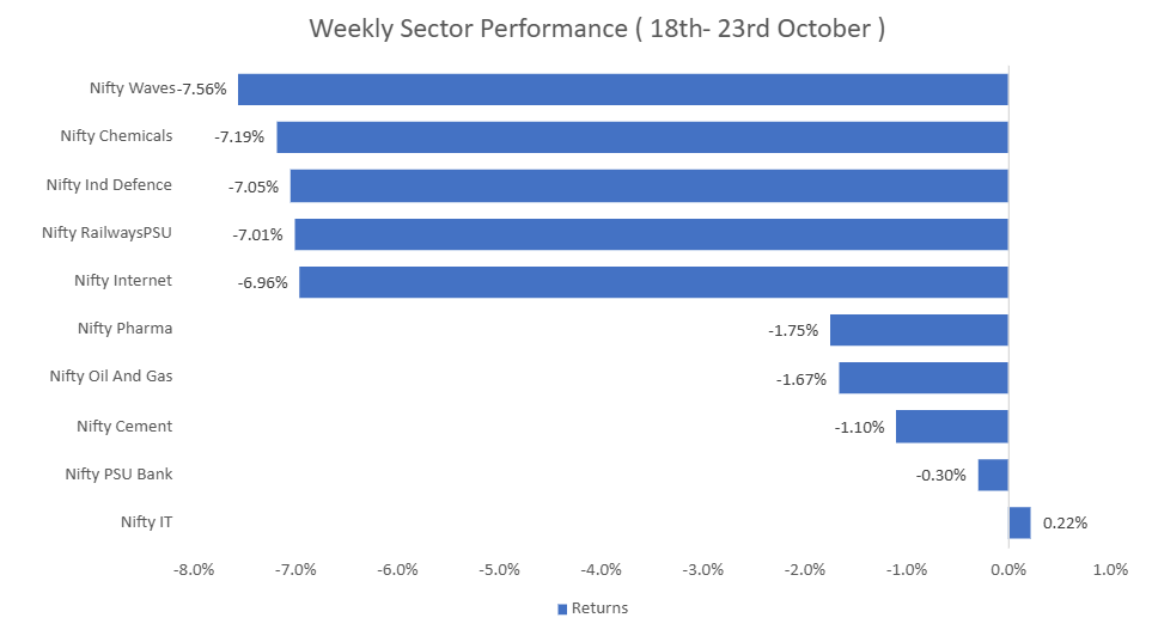
Weekly Sector Performance (18th October – 23rd October)
Stocks in Focus
Nifty 500: Top Eagle stocks
In the Tradepoint and Zone web terminals, we have developed a scanner called the Eagle scanner. It considers the price setup on multiple timeframes, relative strength, matrix scores, and pattern counter scores before scoring the stock.
Below are the top 15 stocks in the Nifty 500 index based on the Eagle score.
In RZone, we have developed a scanner that evaluates both P&F Price and Relative Strength (RS) charts. It allows you to combine price patterns with RS conditions to identify stocks that are showing a bullish/bearish price setup along with relative outperformance/Underperformance.
We also cover this pattern and the process of identifying such stocks in our weekly “Market Kya Lagta Hai” (MKLH) video.
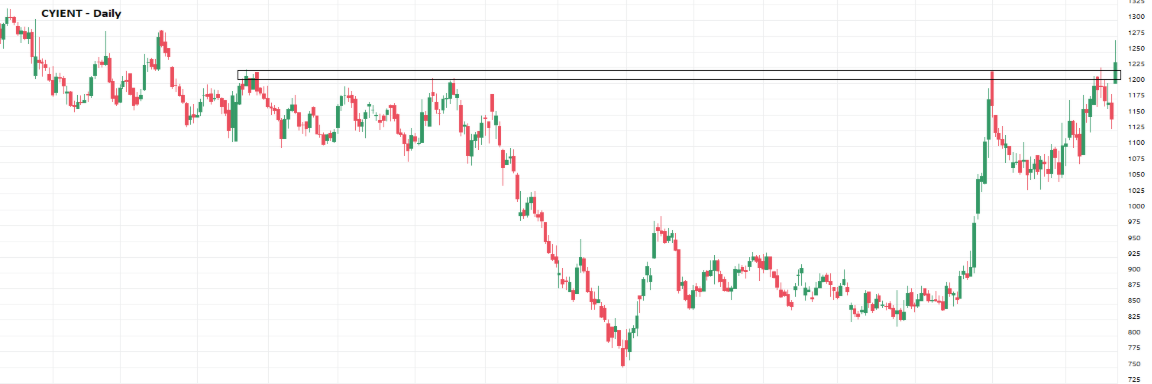
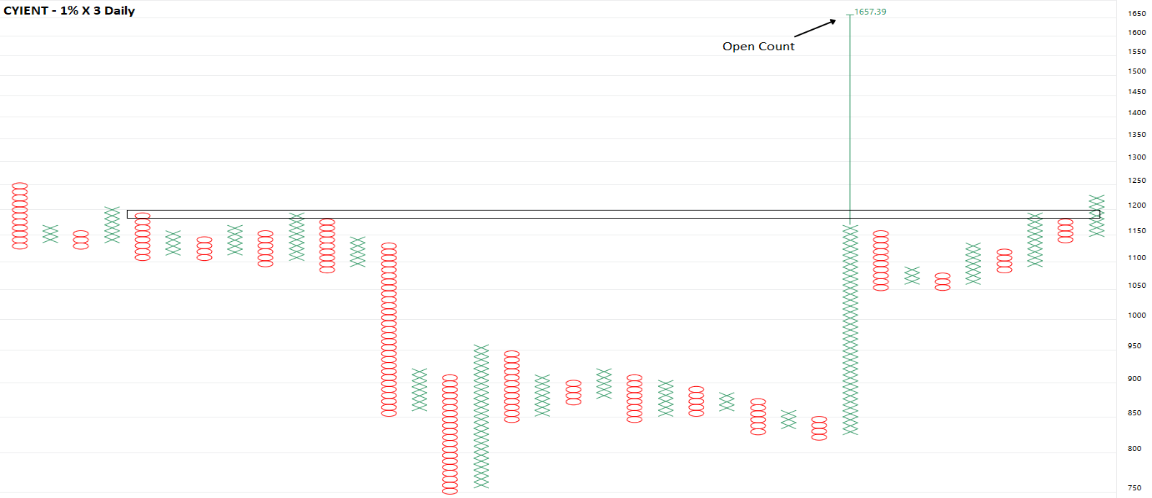
CYIENT faced repeated selling near Rs 1,200 to Rs 1,215 for several months. After falling to around Rs 750, the stock recovered and formed higher lows near Rs 825 and Rs 1,030. An earlier rally failed near resistance, but the stock has now moved above Rs 1,200 to Rs 1,215, touched around Rs 1,262 and is trading near Rs 1,225.
The Point & Figure chart (1% x 3) also shows improving strength. Earlier columns of X faced resistance near Rs 1,180 to Rs 1,195, while the latest column has moved above this zone towards Rs 1,215. The Open Count indicates a potential upside objective near Rs 1,657. Holding above Rs 1,180 to Rs 1,215 would keep the bullish setup in place
JINDALSTEL
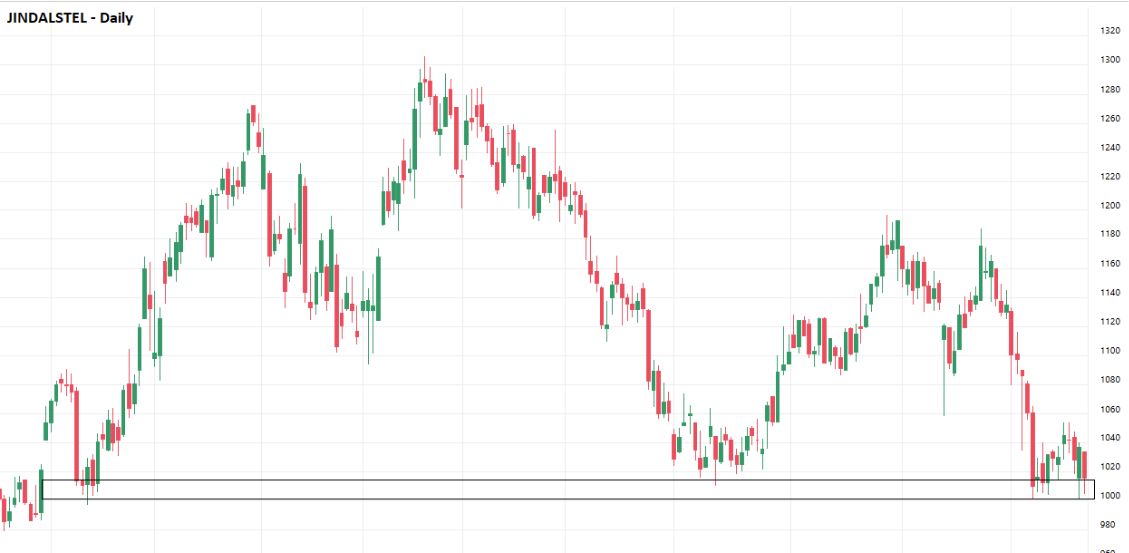
JINDALSTEL has repeatedly found support near Rs 1,000 to Rs 1,010. After reaching around Rs 1,300, the stock formed lower highs near Rs 1,195 and Rs 1,185. The recent decline has brought the price back to the support area, with the stock trading near Rs 1,010.
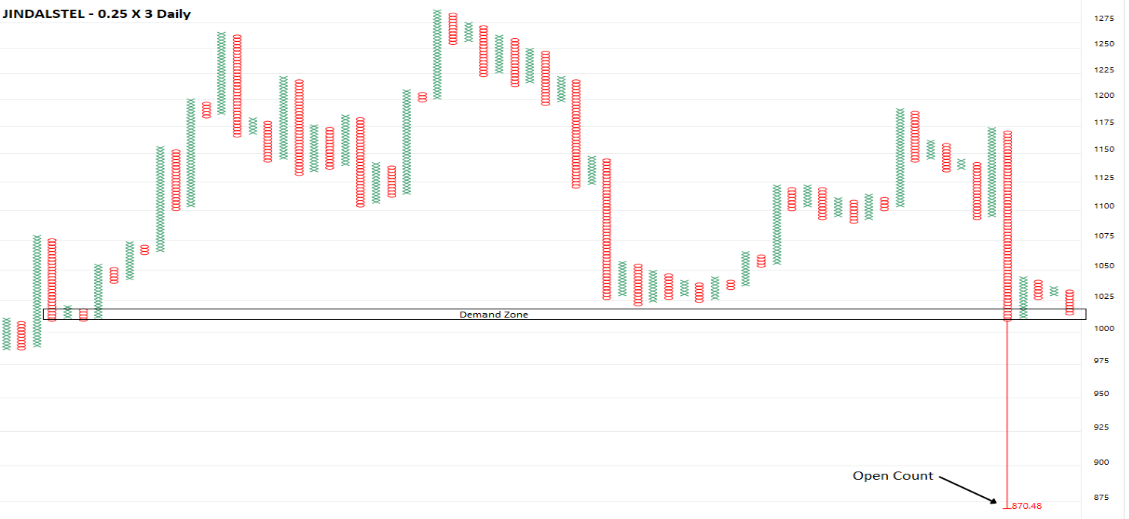
The Point & Figure chart (0.25% x 3) shows repeated tests of the Rs 1,005 to Rs 1,015 support zone. The latest column of O is again approaching this area. The Open Count indicates a possible downside objective near Rs 870. A sustained break below Rs 1,000 would strengthen the bearish view, while holding the support zone could lead to a recovery
Should You Invest in Vodafone and yes Bank?
“Agar ₹200 wala large-cap stock ₹20 par aa jaaye, toh isse neeche kya jayega?”That question sounds like a bargain hunter’s clever line. It can also be the most expensive question an investor asks.
Picture a family wedding. One cousin spots a shiny suit in the sale section, “look, it used to cost ₹20,000. Now it’s just ₹2,000!”
The suit may be a steal or it may have a broken zip, a missing button and no one willing to buy it even at that price. A lower price tells you what the market is offering today. It doesn’t tell you what the thing is worth.
Stocks work much the same way. A share that has fallen sharply can feel irresistible. It attracts bargain hunters, hopeful traders and investors who want to recover an old loss. But a share price can fall because the business is struggling, debt is heavy, profits are weak or confidence has vanished. A low price is not, by itself, a safety net.
In the market, we sometimes call shares that repeatedly destroy investor wealth “toxic stocks”.
Companies such as Unitech, DHFL, Jain Irrigation, Vodafone Idea and Yes Bank remind us that a familiar name or a past reputation cannot guarantee a happy ending for shareholders.
Many people are drawn to a beaten-down share for a reason that has little to do with business value. And it is called as the thrill.
A stock jumps 20% from its low and the mind starts writing a comeback story. It rises another 10%, and suddenly the investor worries about missing the bus. Friends discuss it over chai; social media fills with targets; a small position becomes a big emotional commitment.
That is when a rally can become a trap. Some investors may be buying because the price is rising, while others may be using that demand to exit. But a chart alone cannot prove that a particular rally is a deliberate “pump and dump”.
So how can we avoid being swept along by the crowd?
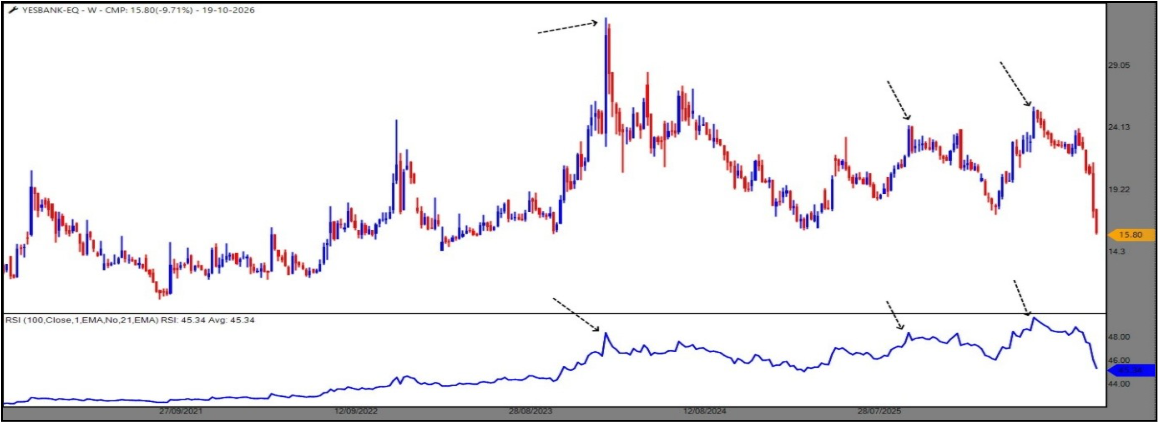
One approach in the “Laidback” strategy is to step away from the daily noise and look at the weekly chart with a 100-period Relative Strength Index (RSI).
In this method, RSI above 55 is treated as a sign that the longer-term trend may be turning bullish. If it remains below 55, the rally may not yet have the strength to confirm a durable change.
A 100-week RSI is a slow-moving measure. It is designed to make an investor wait for evidence, rather than react to every jump or dip. It is not a guarantee, a price target or a forecast. Think of it as a traffic light for trend strength, not a full vehicle inspection.
What do the charts say?
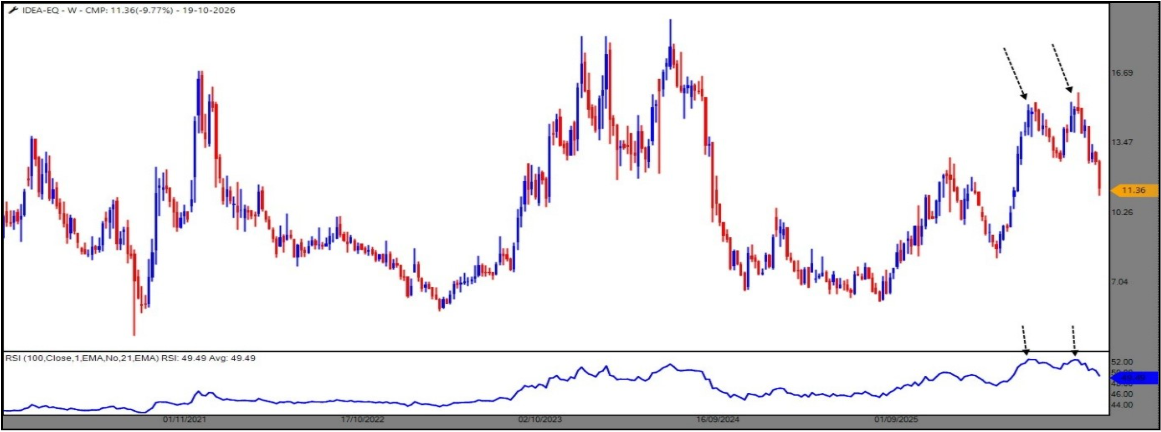
Vodafone Idea: The chart shows a powerful rise from the 2025 lows, followed by two attempts to move higher and a recent pullback.
The plotted 100-week RSI is around 49.49, below the strategy’s 55 threshold. In this framework, the long-term trend has not yet given a bullish confirmation. A rally can still happen, but the indicator says the evidence for a stronger two-year trend is not in place.
The pump and dump of Vodafone Idea from Rs.15.79 to Rs.11.03, a fall of 30%.
Yes Bank: Its chart also shows earlier sharp moves followed by reversals. As of now, the 100-week RSI is around 45.34, well below 55, and has fallen steeply alongside the share price. Under the same rule, that is not a long-term bullish signal. The excitement of a past spike does not change what the indicator is saying now.
These readings don’t prove either share must fall further. Nor do they say a recovery is impossible. They say that, using this particular trend filter, neither chart has crossed the level that the “Laidback” method treats as confirmation. That is a reason to be cautious—not a command to buy or sell.
Before you buy, ask better questions.
A chart can help you judge price behaviour. It cannot replace questions about the business. For a telecom company, investors might study debt, cash flows, subscriber trends, competition and the company’s ability to fund its plans.
For a bank, they might examine bad loans, capital strength, deposit growth, profitability and whether lending is improving. The answers may take time to understand. That is precisely why a rising share price should not rush you.
And be honest about your motive. Are you investing because the business looks stronger, or because you hope the share returns to the price you once saw?
Are you comfortable if the money stays stuck for years or falls further?
Would you buy the same amount if the stock had never traded at a much higher price?
If your plan depends on “it can’t go lower”, it is not yet a plan.
Investing rewards patience, but patience is not the same as waiting blindly. Set a position size you can live with, spread your money across businesses and avoid borrowing to chase a hot stock. If you use a technical rule, follow it consistently and understand its limits. A single indicator should not carry the whole weight of your decision.
For Vodafone Idea and Yes Bank are recent examples as the 100-week RSI readings remain below 55. By the rule described here, the charts have not confirmed a strong long-term bullish trend. That does not settle their future. It gives cautious investors a reason to wait for clearer evidence and to check the businesses themselves.
There is no shame in saying, “I will watch for now.” The market will offer another opportunity. Your capital, once lost, may not come back. Sometimes the smartest trade is not the one that catches the first jump; it is the one you never made because you paused, checked the facts and kept your head.
FII — DII Activity
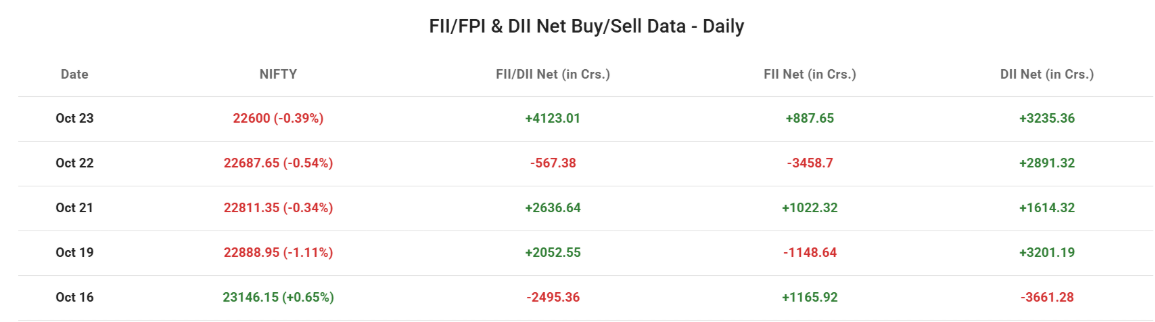
Foreign investors were mixed during the holiday-shortened week, alternating between selling and buying, and their overall selling was much lighter than in the previous week. FIIs sold around Rs 1,149 crore on Monday, 19 Oct, before turning buyers on Wednesday with purchases of around Rs 1,022 crore. Selling returned sharply on Thursday, with outflows of around Rs 3,459 crore, the largest of the week, before FIIs bought again on Friday with purchases of approximately Rs 888 crore. Overall, FIIs were net sellers of around Rs 2,697 crore during the week, compared with around Rs 8,991 crore in the previous week.
Domestic institutions were buyers on every trading day and remained strongly supportive. DIIs bought around Rs 3,201 crore on Monday, Rs 1,614 crore on Wednesday, Rs 2,891 crore on Thursday and Rs 3,235 crore on Friday. Overall, DIIs ended the week as net buyers of around Rs 10,942 crore, higher than their buying of around Rs 7,813 crore in the previous week.
Overall, DII buying far outweighed the foreign outflow, and the combined institutional net flow was positive on three of the four days, at around Rs 8,245 crore for the week. Even so, the market declined. Nifty closed at 22,600 on Friday, 23 Oct, compared with 23,146.15 on the previous Friday, 16 Oct, a weekly fall of around 2.36%. The decline despite strong net institutional buying suggests that selling pressure came from other participants, and that DII support was not enough to stop the market sliding lower.
FII, PRO & CLIENT POSITIONING – WEEKLY VIEW
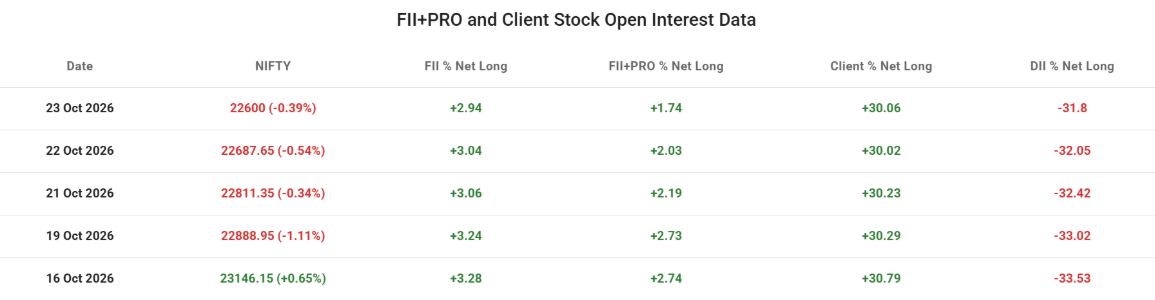
During the holiday-shortened week, Nifty fell, closing at 22,600 on Friday, 23 Oct, compared with 23,146.15 on the previous Friday, 16 Oct, a weekly decline of around 2.36%. The index fell on all four trading days: Monday (-1.11%), Wednesday (-0.34%), Thursday (-0.54%) and Friday (-0.39%). Monday saw the sharpest fall, and the index then drifted steadily lower to end at the weeks low on Friday.
FII positioning in stock open interest weakened steadily, with FII % Net Long falling from +3.28% on 16 Oct to +2.94% on 23 Oct. The figure declined on every trading day, which shows that FIIs gradually reduced their net long exposure as the market moved lower.
FII+PRO % Net Long fell more sharply, from +2.74% to +1.74%. This drop of one full percentage point was much larger than that of FIIs alone, which suggests professional traders cut their long positions or added shorts during the decline. Most of this fall came from Wednesday onwards.
Client positioning remained strongly positive and eased slightly, with Client % Net Long moving from +30.79% on 16 Oct to +30.06% on 23 Oct. The figure declined through Thursday and then ticked up marginally on Friday, which indicates that clients largely held on to their long exposure despite the fall.
DIIs continued to hold a large net short position, but it narrowed steadily, with DII % Net Long improving from -33.53% on 16 Oct to -31.80% on 23 Oct. Their net short exposure fell on every trading day of the week.
Overall, FIIs and especially FII+PRO participants reduced their net long positions during the 2.36% fall in Nifty, while clients stayed heavily net long and DIIs continued to trim their shorts. Institutional and professional confidence therefore weakened during the decline, while retail positioning barely changed. Clients remain heavily net long and DIIs deeply net short, so the markets overall positioning is still lopsided.
Future Open Interest Buildup
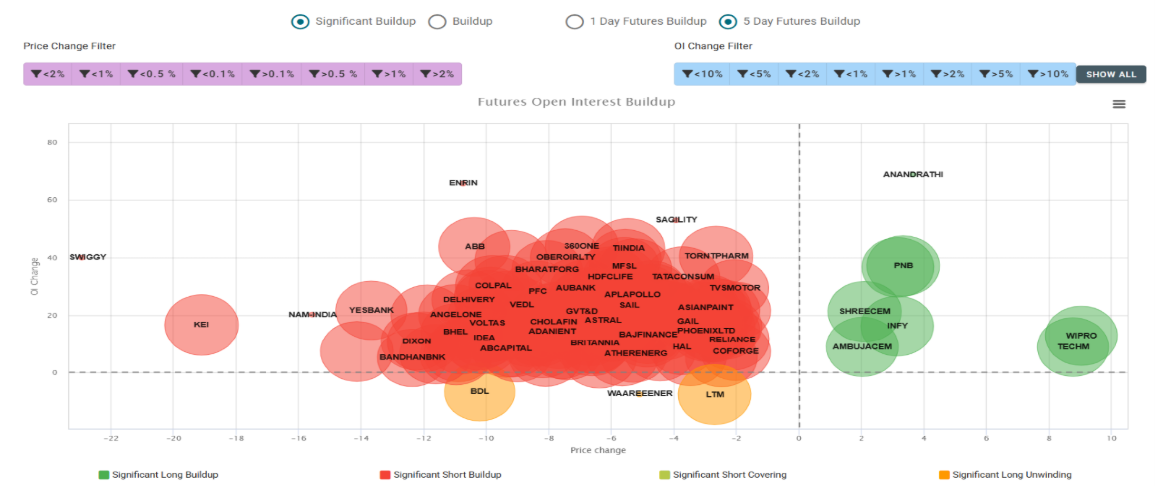
The futures market showed a clearly negative tilt this week, with significant short buildup dominating the chart, while a small group of stocks on the upside saw fresh long positions.
On the positive side, Wipro, Tech Mahindra, Infosys, PNB, Anand Rathi, Shree Cement and Ambuja Cements saw rising prices along with increasing Open Interest, pointing to fresh long buildup. Wipro and Tech Mahindra stood out with gains of nearly 9%. Anand Rathi recorded a sharp rise of nearly 70% in Open Interest alongside a gain of around 3.5%, and PNB saw Open Interest rise by over 35%. IT and cement stocks featured prominently on the long side.
On the other hand, a large cluster of stocks witnessed falling prices along with rising Open Interest, indicating fresh short positions. These included Swiggy, KEI Industries, Nippon Life India AMC, Yes Bank, ABB, Dixon, Bandhan Bank, BHEL, Angel One, Voltas, Vodafone Idea, Aditya Birla Capital, Delhivery, Colgate-Palmolive, PFC, Vedanta, Bharat Forge, Oberoi Realty, 360 ONE, Tube Investments, Max Financial, HDFC Life, Tata Consumer, Torrent Pharma, TVS Motor, AU Small Finance Bank, Apollo Hospitals, SAIL, GE Vernova T&D, Cholamandalam Finance, Astral, Adani Enterprises, Britannia, Bajaj Finance, Asian Paints, GAIL, Phoenix Mills, Reliance, HAL, Coforge and Ather Energy. Swiggy was the weakest, falling around 23% with a rise of around 40% in Open Interest, while KEI Industries declined around 19%. Enrin and Sagility recorded the largest increases in Open Interest among the decliners, at around 65% and 50% respectively.
BDL, LTIMindtree and Waaree Energies saw long unwinding, as both their prices and Open Interest declined. BDL was the weakest of the three, falling around 10%.No significant short covering was visible on the chart this week.
The size of each bubble represents the stocks Volume Percentile, with larger bubbles highlighting stocks that saw unusually high futures trading activity compared with the past year.
Overall, short buildup was the dominant theme, spread across financials, capital goods, consumer, auto and energy stocks, which points to broad-based bearish positioning. IT, select cement names and PNB were the main pockets of strength, but they were heavily outnumbered, so the futures setup remains cautious with a bearish bias
Companies Delivering Growth Across Sales, Margins and Earnings
Quarterly results are usually read one company at a time, but they can also be screened together to find businesses where growth is showing up in sales, margins and earnings at once. This matters more when markets are falling, as good businesses often get sold along with weak ones, and earnings help separate the two.
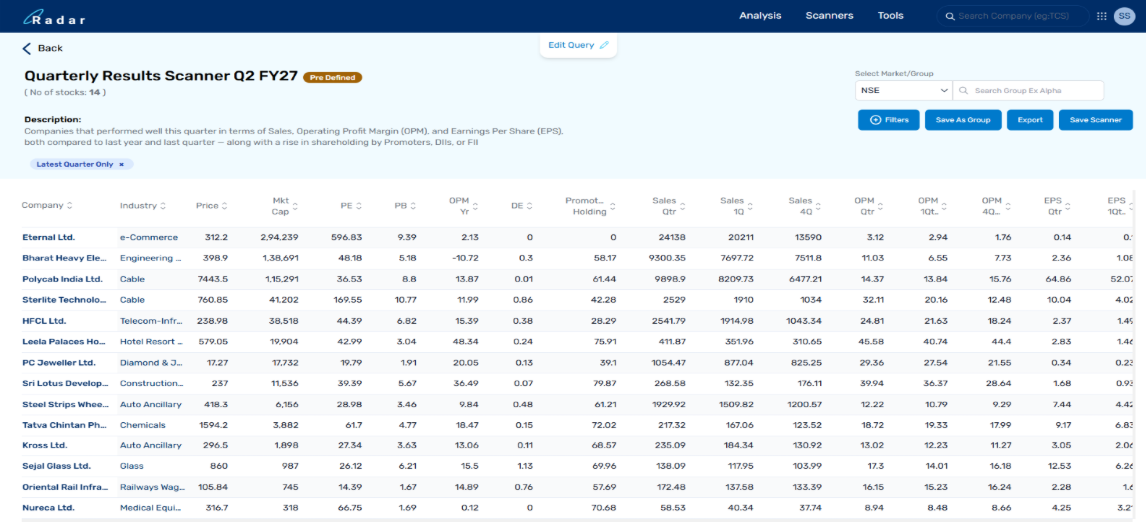
The Quarterly Results Scanner on Radar is built to find companies whose latest quarter shows broad-based growth rather than a one-off jump in a single number. It filters for companies whose quarterly sales and EPS have grown more than 15% over both the previous quarter and the same quarter last year. Comparing with the previous quarter captures momentum, while comparing with the same quarter last year removes seasonal effects. Operating margins must also improve on at least one of these comparisons, so that growth is coming with better profitability and not at its cost. EPS has to be positive in all three quarters, which keeps out loss-to-profit turnarounds where percentage growth looks large but says little. Finally, the scanner checks whether promoters, FIIs or DIIs have raised their stake, as a sign that informed investors are backing the numbers. Companies below Rs 250 crore in market cap are left out.
For Q2 FY27, 14 NSE companies have passed the screen so far. Sterlite Technologies, HFCL and Kross reported the strongest year-on-year sales growth, while BHEL stood out for margin expansion, with its operating margin rising from 6.6% to 11.0% in a single quarter. Cables and telecom infrastructure showed up as a cluster, with Polycab, Sterlite Technologies and HFCL all on the list.
As with any screen, these results should be read alongside valuations, the sustainability of growth and management commentary before drawing investment conclusions. Some names, such as Eternal, trade at very high valuations, and a strong quarter may partly reflect a weak base a year ago.
Note: The screen only covers companies that have already declared Q2 FY27 results. The list will change as more companies report over the coming weeks.
Things are turning ugly
Last week we shared a few data points pointing to warning signs that things are looking bad for the broader markets. This week, we will look at a few other data points that corroborates with the warning sign highlighted last week.
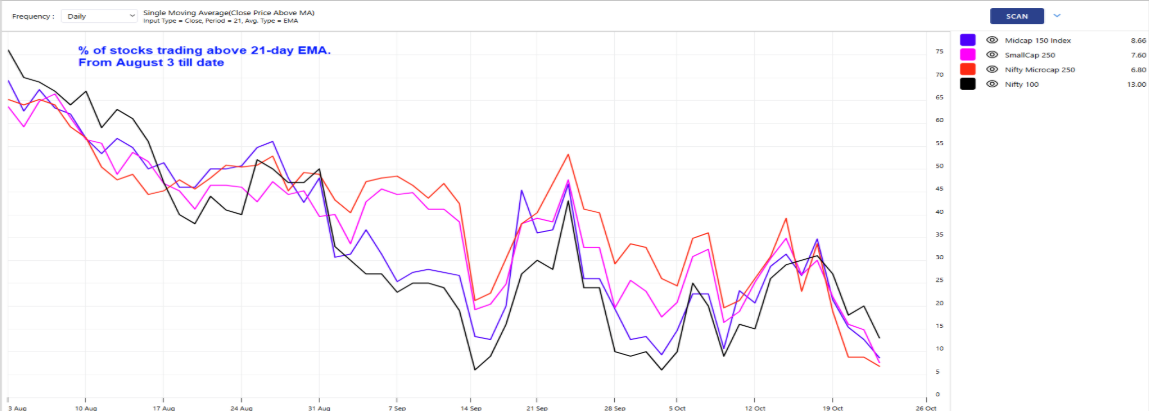
The chart above captures the short-term breadth indicator of large, mid, small and microcap stocks, from the August 3 high. Just for the record, August 3 was when the Nifty 50 index topped out and until then, the small and microcap stocks were outperforming the large cap counterparts.
Notice how the table flipped around during the fall. The breadth indicator of the large cap universe represented by the Nifty 100 index is higher at 13% compared to 6.8% for the microcap universe. A look at the recent performance of these indices would make a even more compelling case.
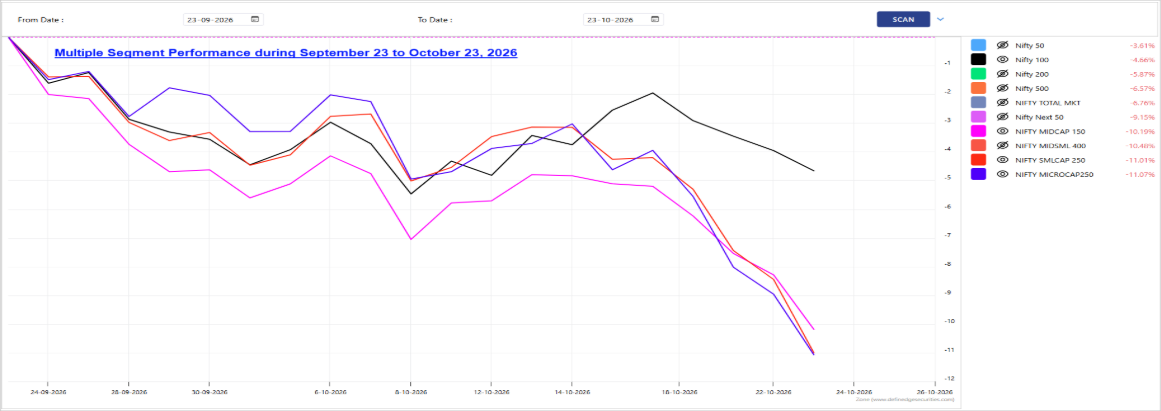
Notice how the broader markets have dramatically underperformed the large cap universe. The Nifty 100 index dropped 3.61% in the past month while the Microcap 250 index lost 11%.
According to Gary Anderson’s work on Relative Strength (described in his book The Janus Factor), the reversal of roles between erstwhile outperformers and underperformers is a sign that market is in a reversal or corrective mode.
For those who are inquisitive, you can look at prior instances to get an idea about this role reversal behavior. The key takeaway is that whatever metric you look at, the broader market and the overall market sentiment are not positive.
There could be instances of sharp oversold bounce but be cautious is the overarching message.