September was a difficult month for the Nifty 50, with the index falling 6.06%, making it the second-worst September since 2009, after the 6.42% decline in 2018.The options setup also remains cautious. OTM puts are still trading at higher IVs than equidistant OTM calls, even after the sharp fall in September. This shows that traders continue to pay a premium for downside protection, keeping puts relatively expensive compared with calls.
On the technical side, Nifty has closed below its 200-week moving average for the first time since 2020. Market breadth is also extremely weak, with only 16% of stocks trading above their 200-day moving average, while the Nifty 50 X% breadth is in the extreme zone. This suggests that although the broader trend remains weak, fresh positional shorts should be avoided at current levels, as the market may see a price or time-wise correction after the sharp decline. In such an oversold environment, fresh breakout trades may also offer limited risk-reward.
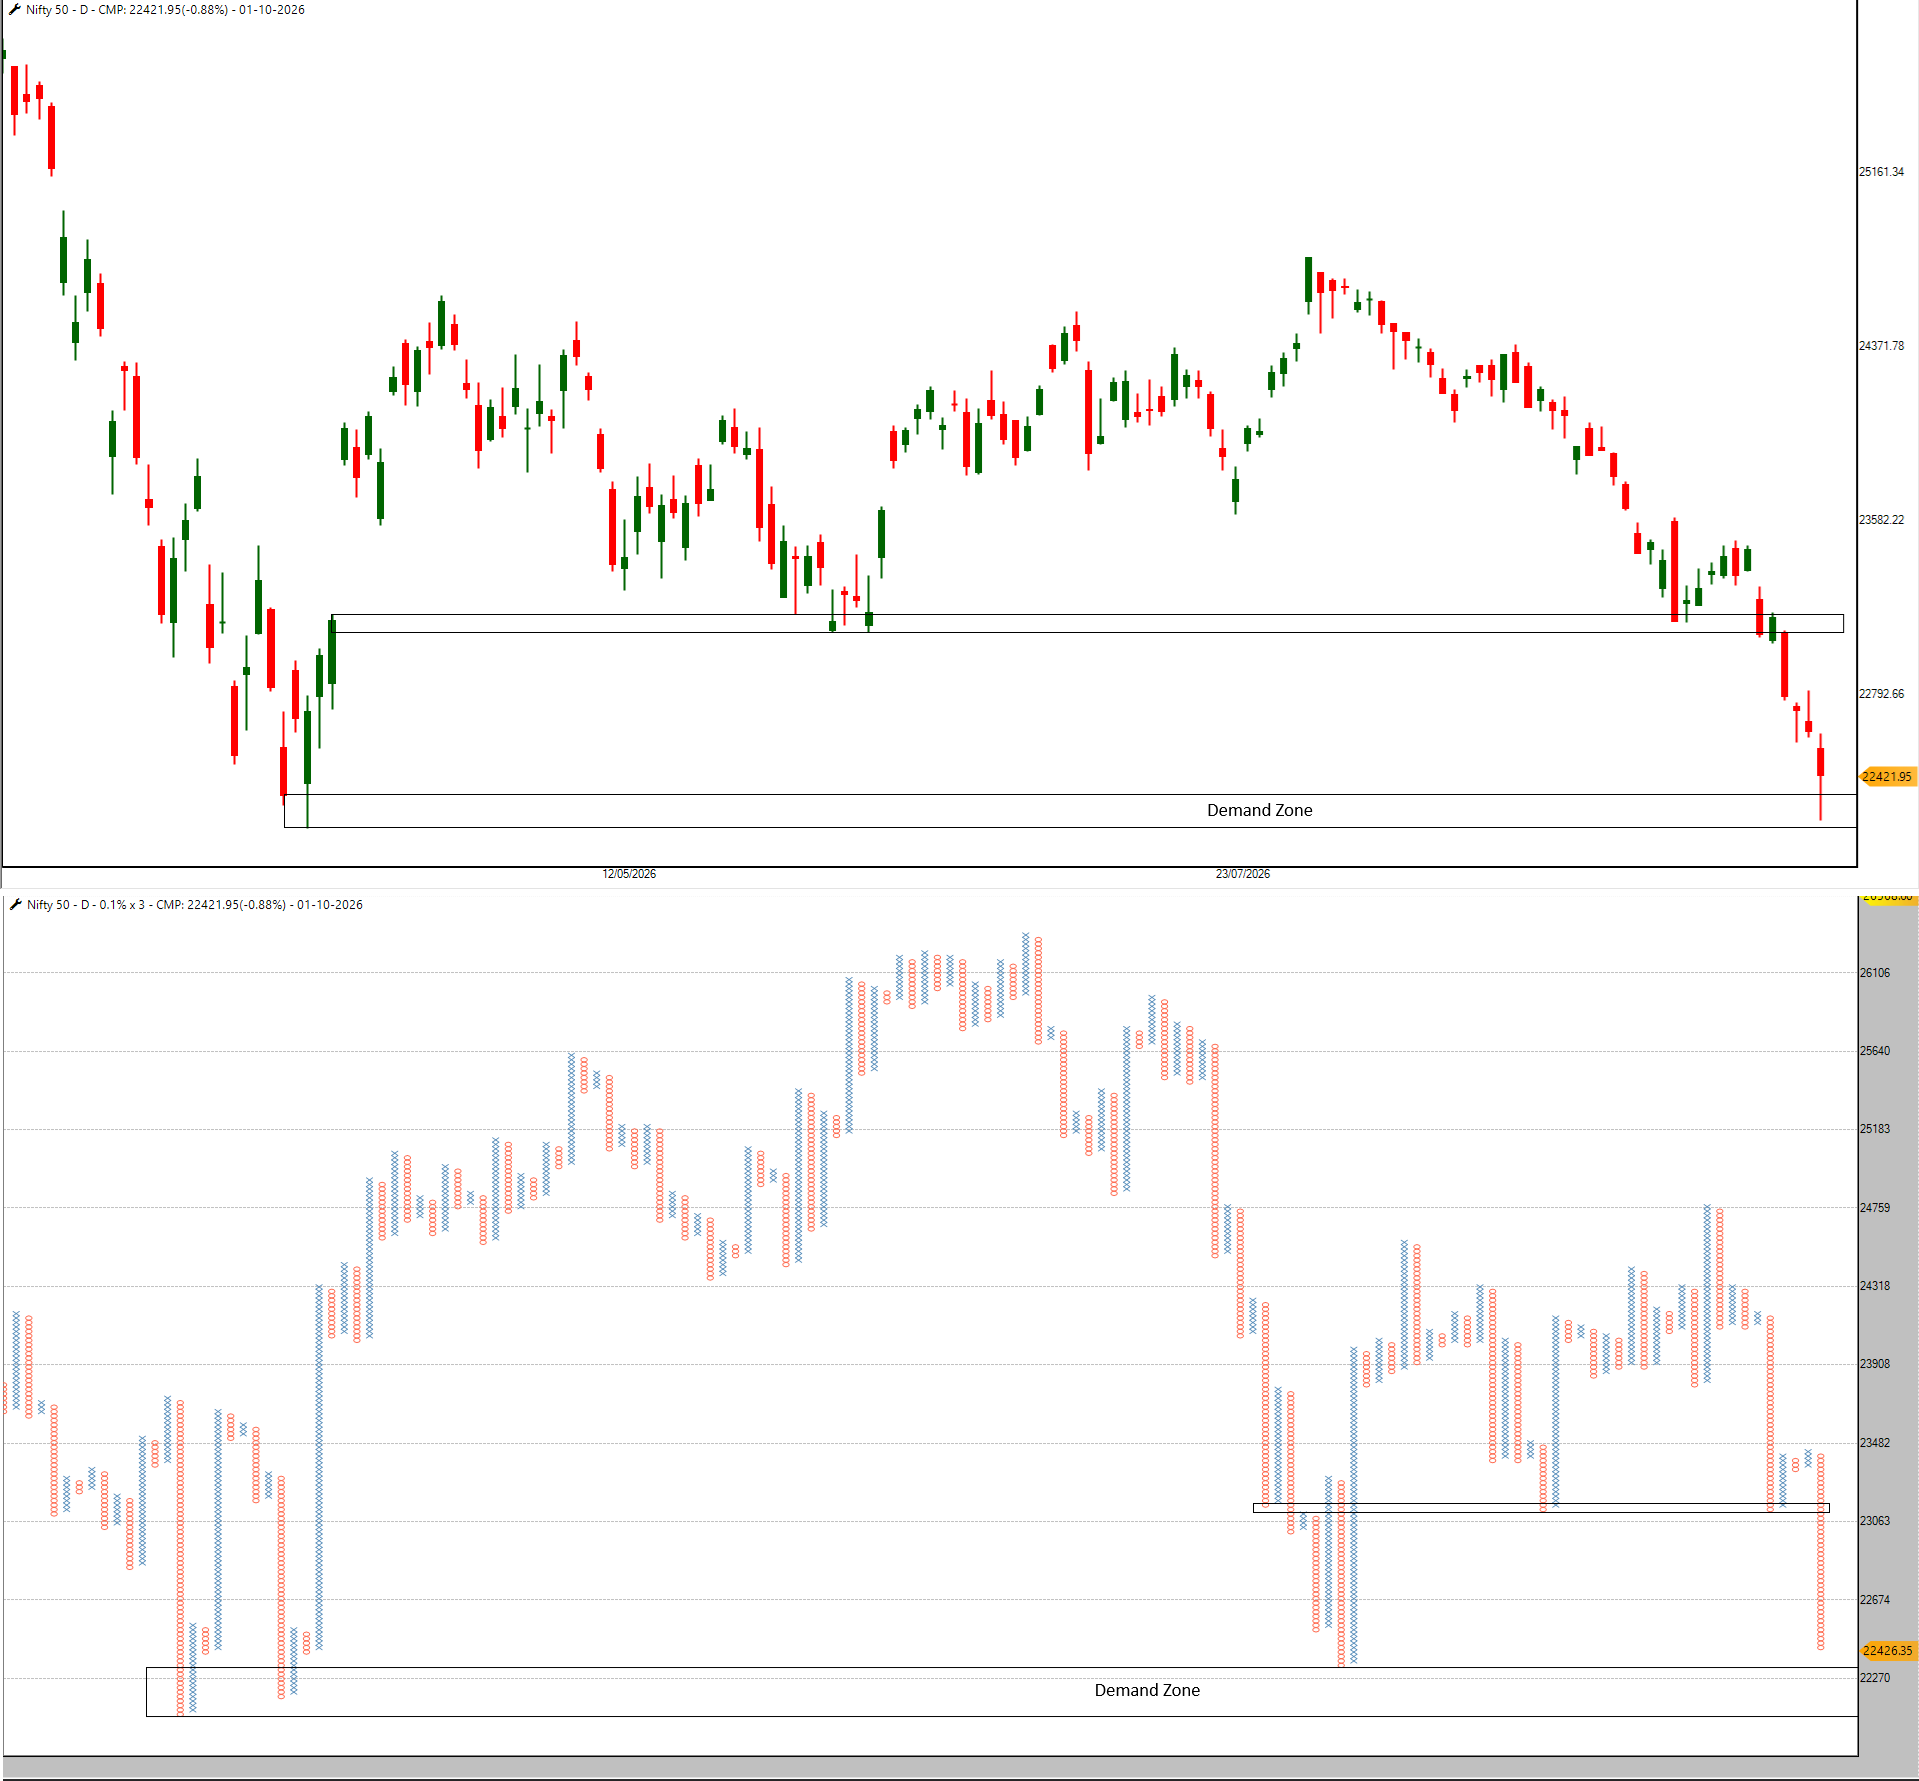
The charts show an important demand zone around 22,150–22,300. Holding this area could lead to some recovery, while a decisive break below 22,150 may extend the weakness.
Levels to Watch:
Immediate Resistance: 22,700–22,800
Above 22,800: Upside towards 23,000–23,050
Immediate Support: 22,150–22,300
Below 22,150: Downside towards 22,000–21,750
BANKNIFTY SHORT TERM VIEW
The RBI policy meeting in the first week of October will be an important event for the market. Any comfort on interest rates, inflation and liquidity could help ease some of the current pressure and support market stabilisation. However, with crude oil prices and bond yields remaining elevated, a cautious RBI stance could keep sentiment under pressure and lead to further weakness.
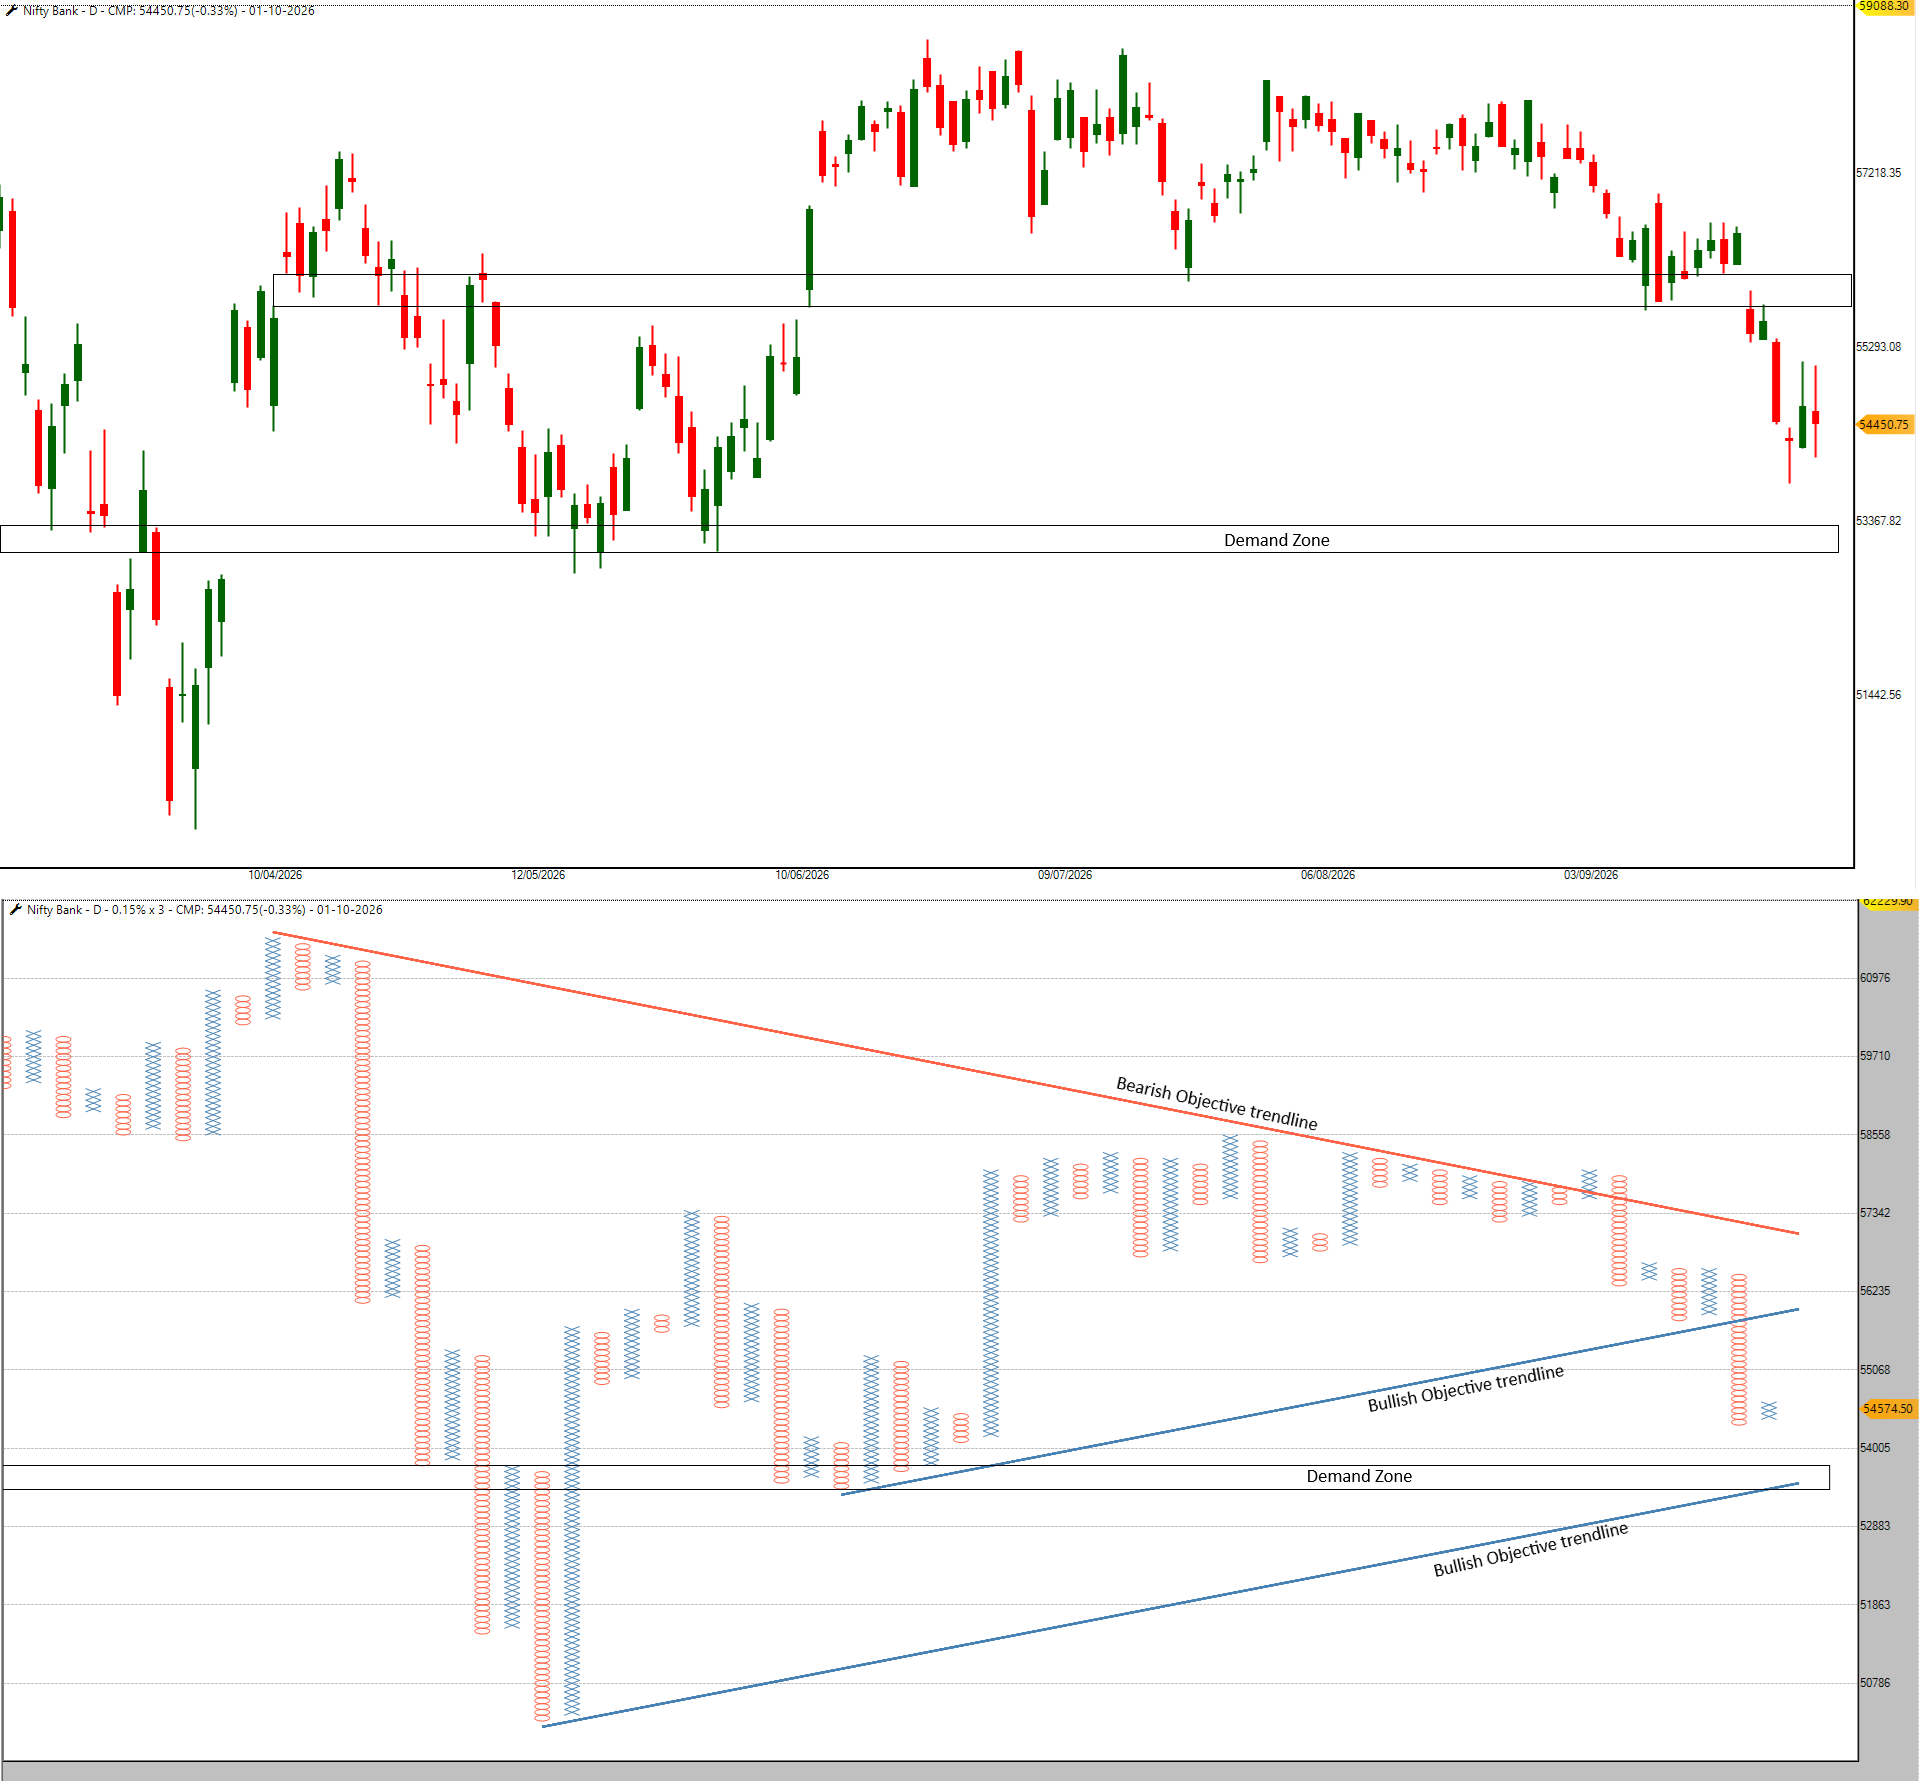
On the technical front, Nifty Bank has weakened considerably. The daily candlestick chart shows a breakdown below the recent support zone, with the index now moving towards the 53,500–53,700 demand zone, which has provided support earlier.
The Point & Figure chart also confirms the weakening structure, as Nifty Bank has broken below the bullish objective trendline. Interestingly, the next bullish objective trendline is also placed near the same demand area, making 53,500–53,700 a crucial support zone. Holding this area could trigger a recovery, while a decisive break below it may increase downside pressure.
Levels to Watch:
Immediate Resistance: 55,000–55,150
Above 55,150: Opens upside towards 55,500–55,750
Immediate Support: 53,500–53,700
Market Breadth
NIFTY 500 MARKET BREADTH
P&F X% Breadth
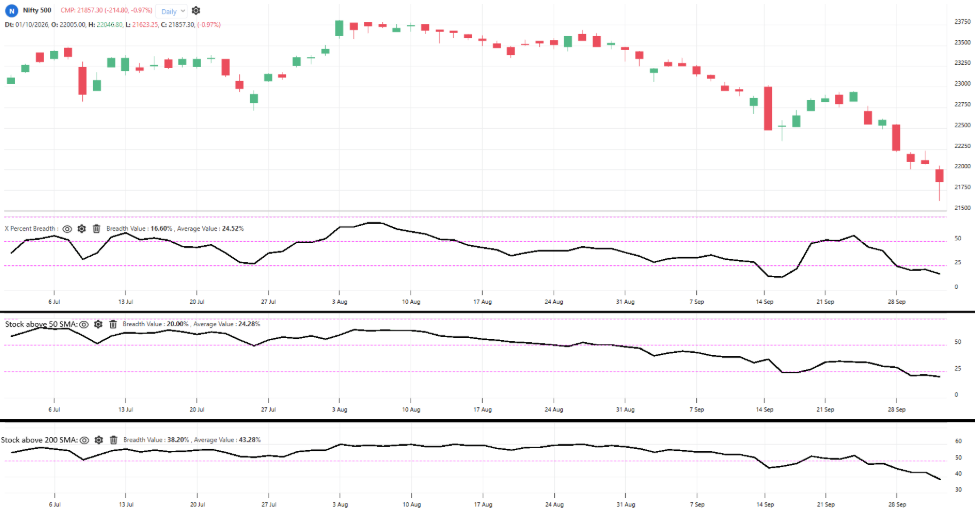
The P&F X% Breadth Indicator is currently at 16.60%, with around 83 stocks in the X column. The indicator has declined sharply from the previous week and is now in the oversold zone, indicating weak short-term market breadth. At these levels, the market is showing signs of extreme weakness, although oversold conditions can also lead to a short-term recovery.
Stocks Above 50-Day Moving Average
The Stocks Above 50-Day Moving Average indicator is currently at 20.00%, with around 100 stocks trading above their 50-day moving average. The indicator has declined further from the previous week and is now in the oversold zone, reflecting continued weakness in medium-term market participation.
Stocks Above 200-Day Moving Average
The Stocks Above 200-Day Moving Average indicator is currently at 38.20%, with around 191 stocks trading above their 200-day moving average. The indicator has also declined compared to the previous week and has moved further below the 50% level, indicating that long-term market participation is getting weaker.
Overall, market breadth has weakened further compared to the previous week. Both P&F X% Breadth and 50-Day Moving Average breadth have moved into oversold zones, while 200-Day Moving Average breadth is also declining and remains below 50%. This shows that market participation continues to remain weak across short, medium and long-term.
RELATIVE STRENGTH OF MAJOR ASSET CLASSES:
Nifty 50 (Top-Left Chart)
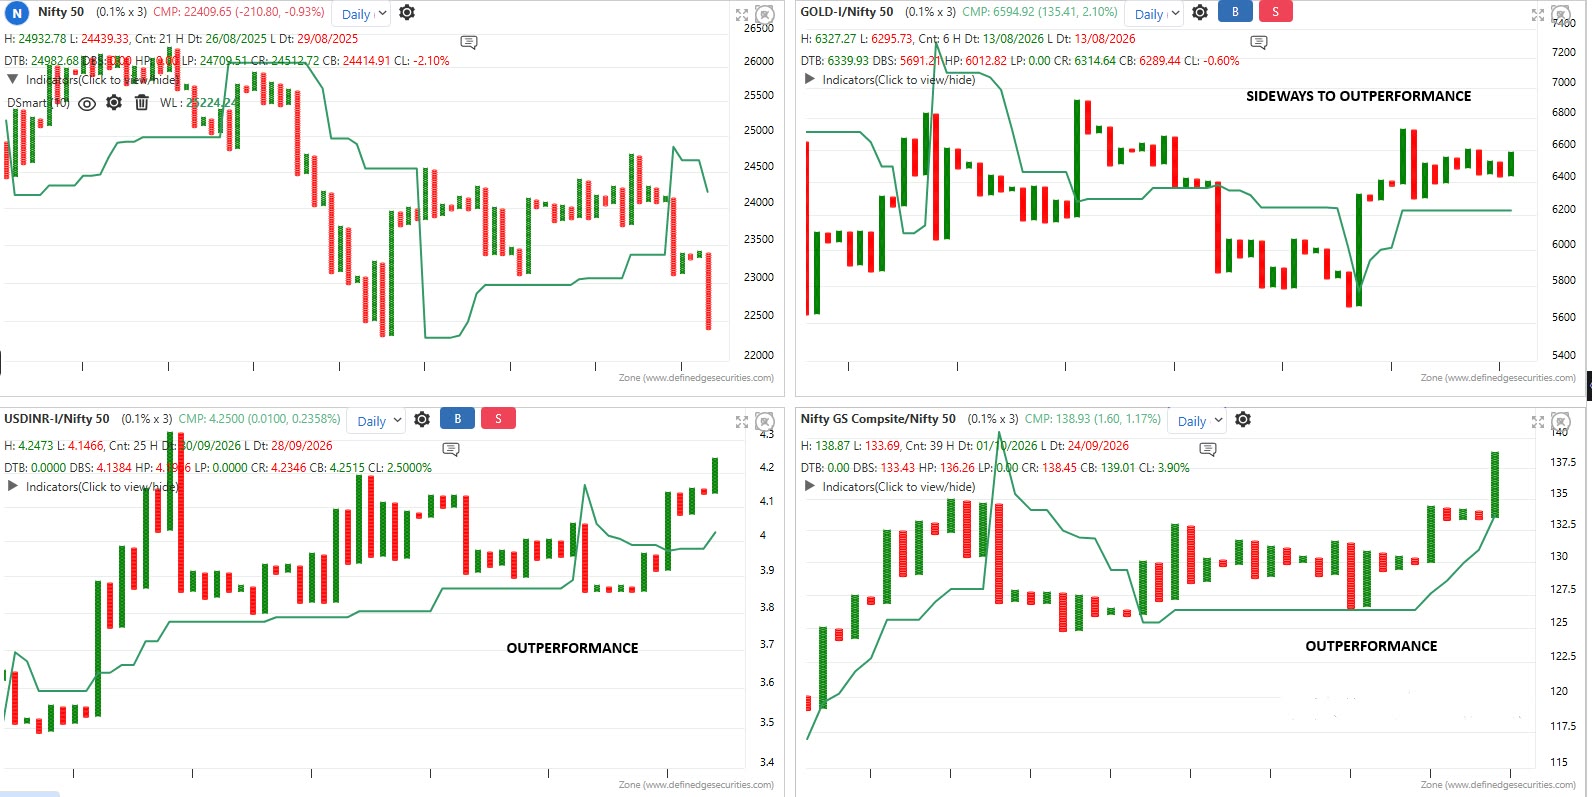
Nifty 50 remains weak and is trading in a negative column below the D-Smart line, keeping the overall trend bearish. The Nifty 50 X% Breadth has dropped to 10%, which is in the extreme oversold zone. At such levels, fresh positional shorts should be avoided, as we may see some price or time correction in the coming days.
Gold vs Nifty 50 (Top-Right Chart)
Gold continues to outperform the Nifty 50 and remains above the D-Smart line. After a strong up move, the ratio is now consolidating. A move above the recent high would further strengthen Gold’s outperformance against equities.
USDINR vs Nifty 50 (Bottom-Left Chart)
USDINR continues to outperform the Nifty 50. The ratio is trading above the D-Smart line and has formed a strong positive column this week. As long as it remains above the D-Smart line, the relative strength of USDINR against equities remains intact.
Nifty G-Sec Composite vs Nifty 50 (Bottom-Right Chart)
Bonds are also outperforming the Nifty 50. The ratio remains above the D-Smart line and has strengthened further this week, showing continued preference for bonds over equities.
Overall
The intermarket setup remains negative for equities. Gold, USDINR and Bonds are all outperforming the Nifty 50, which is generally not a good sign for equities, as money appears to favour defensive asset classes over stocks. However, with Nifty 50 X% Breadth at just 10% and in the extreme oversold zone, fresh shorts should be avoided at current levels. It would be better to wait for some price or time correction before taking a fresh directional view.
RELATIVE STRENGTH OF BROADER MARKET INDICES
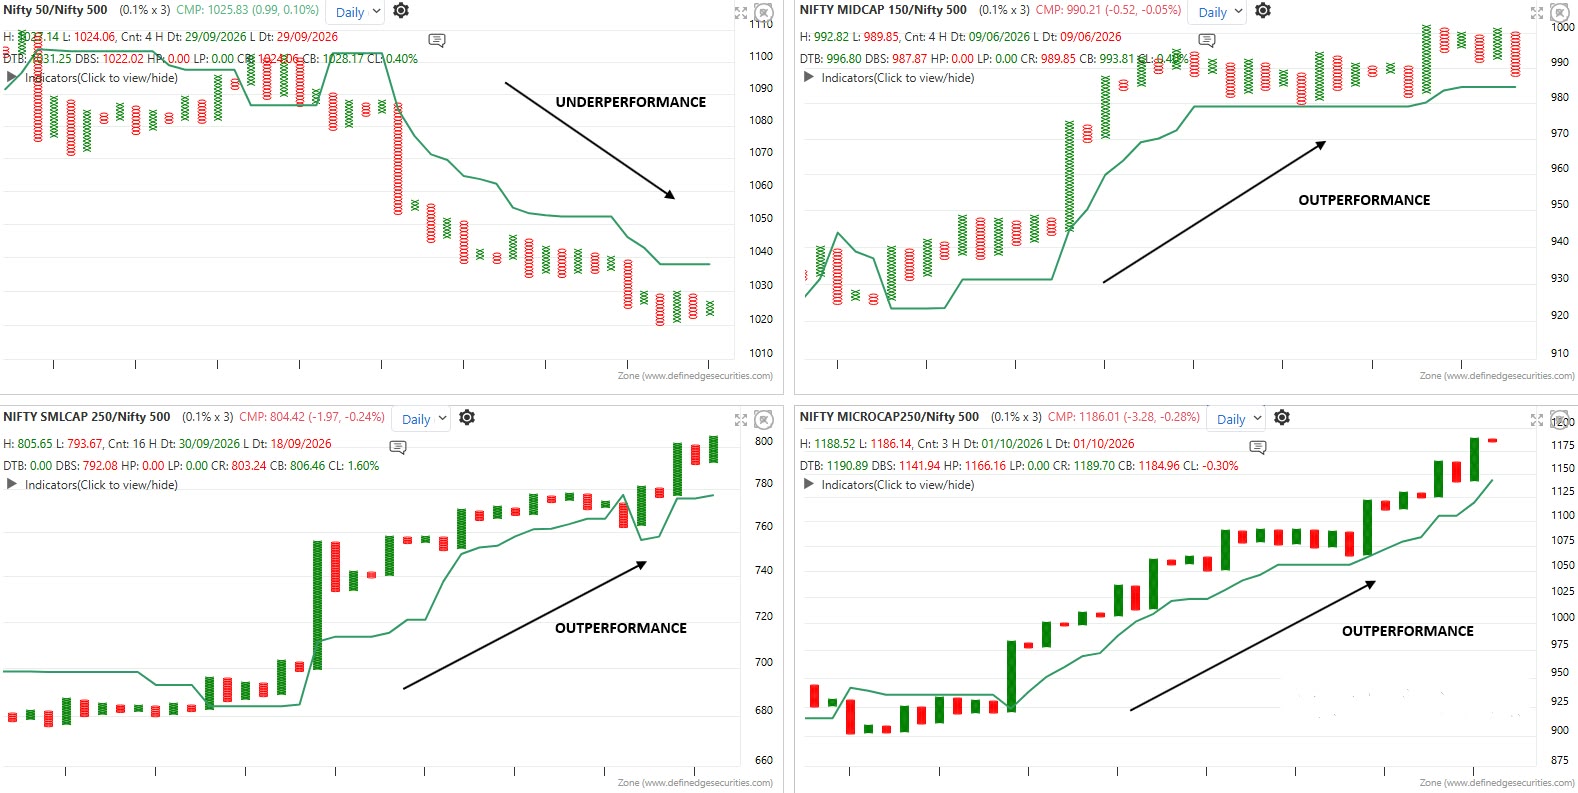
Nifty 50 / Nifty 500 (Top-Left Chart)
The RS chart of Nifty 50 vs Nifty 500 continues to remain in a downtrend, showing that large-cap stocks are still underperforming the broader market. The ratio remains weak and continues to trade below its D-Smart line, with no meaningful improvement in relative strength yet.
Nifty Midcap 150 / Nifty 500 (Top-Right Chart)
The Nifty Midcap 150 vs Nifty 500 RS chart continues to show outperformance. After the earlier sharp rise, the ratio is now consolidating near its highs while remaining above the D-Smart line, keeping the relative strength positive.
The Nifty Smallcap 250 vs Nifty 500 ratio continues to show strong outperformance. The ratio remains above the D-Smart line and is still strengthening near its highs, indicating that relative strength continues to favour the Smallcap segment.
The Nifty Microcap 250 vs Nifty 500 RS chart continues to remain in an outperformance phase. The ratio has continued to move higher with strong follow-through and remains above the D-Smart line, showing that Microcaps are still strengthening and maintaining strong relative performance.
Overall, Nifty Midcap 150, Smallcap 250 and Microcap 250 continue to outperform the Nifty 500, while Nifty 50 remains in an underperformance phase. Midcap is consolidating near its highs, while Smallcap and Microcap continue to strengthen and remain above their respective D-Smart lines.
Sectors On Radar
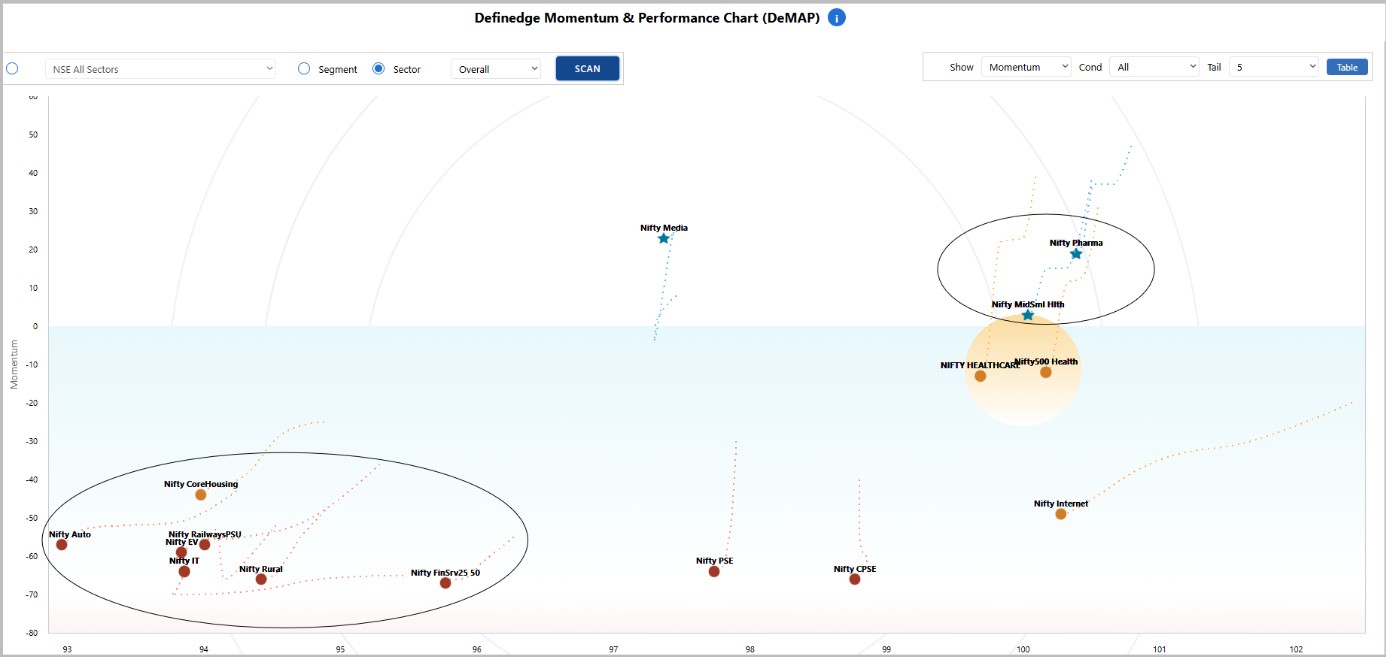
DEFINEDGE MOMENTUM AND PERFORMANCE CHART
Definedge Momentum and Performance (DeMAP) is a unique study developed by Definedge that helps you analyse the market at a glance. It combines price analysis, momentum, trend-following indicators, oscillators, Relative Strength,
Dynamic Relative Strength and other popular market factors to calculate Momentum and Performance levels.
DeMAP is divided into two zones, Sky and Water. Stocks above the zero line are in the Sky and shown as Stars, while those below are in the Water and shown as Circles. Green Stars indicate strong bullish momentum, Blue Stars semibullish, Red Circles bearish and Orange Circles semi-bearish.
The circle in each chart acts like a Sun, with its position indicating the sector's stance left for bullish, middle for neutral
and right for bearish.
DEMAP
Strong sectors : Nifty Pharma, Nifty MidSml Health
Weak sectors : Nifty Fin Service, Nifty Core Housing, Nifty Rural, Nifty RailwaysPSU, Nifty IT, Nifty EV, Nifty Auto
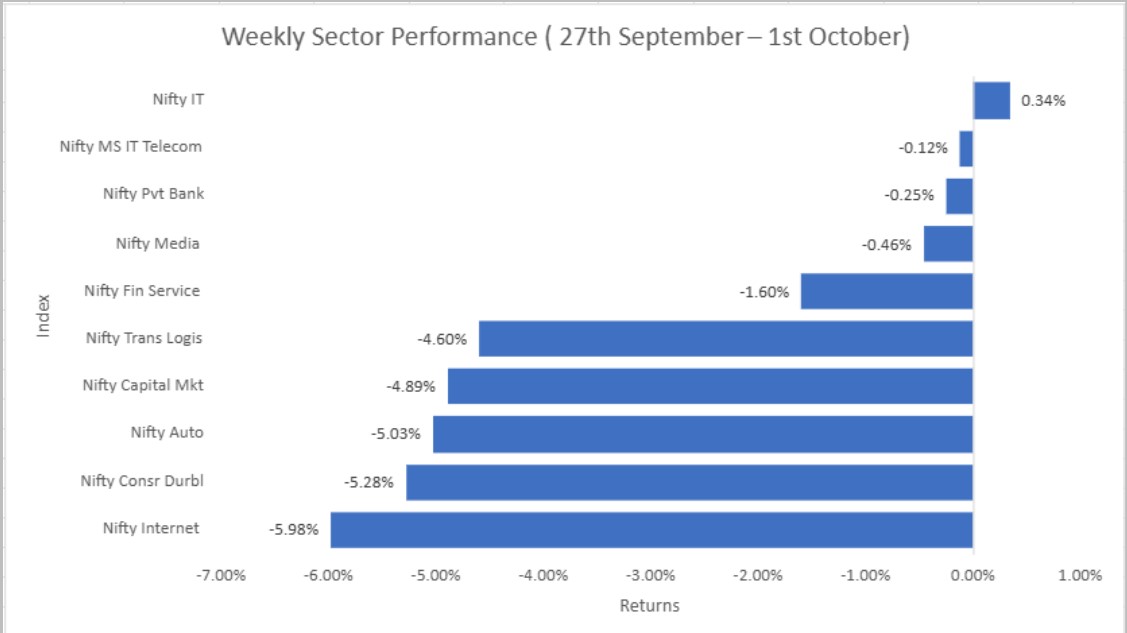
Weekly Sector Performance (27th September - 1st October)
Stocks in Focus
Nifty 500: Top Eagle stocks
In the Tradepoint and Zone web terminals, we have developed a scanner called the Eagle scanner. It considers the price setup on multiple timeframes, relative strength, matrix scores and pattern counter scores before scoring the stock.
Below are the top 15 stocks in the Nifty 500 index based on the Eagle score.
100% Pole Follow Through - Bullish; Follow through -Bullish; Immediate Bullish AFT; Low Pole Follow Through - Bullish; Super Pattern - Bullish; Turtle Follow-Through Bullish
In RZone, we have developed a scanner that evaluates both P&F Price and Relative Strength (RS) charts. It allows you to combine price patterns with RS conditions to identify stocks that are showing a bullish/bearish price setup along with relative outperformance/Underperformance.
We also cover this pattern and the process of identifying such stocks in our weekly “Market Kya Lagta Hai” (MKLH) video.
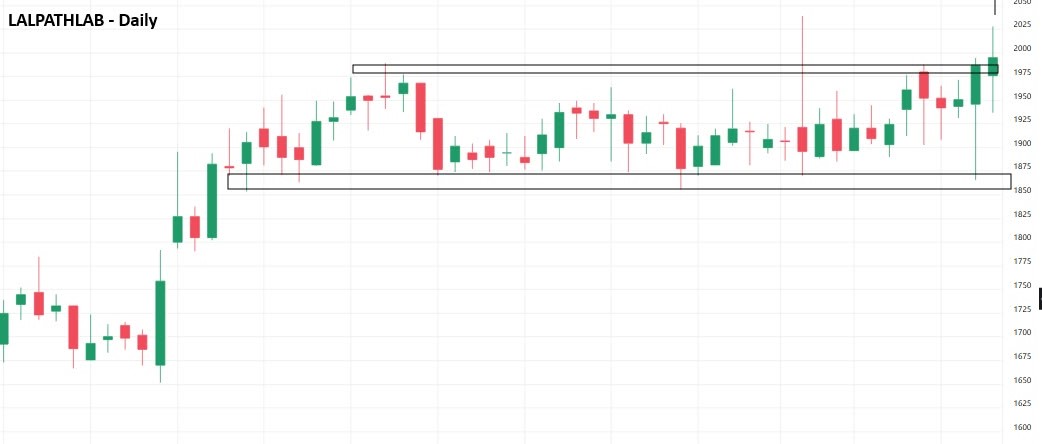
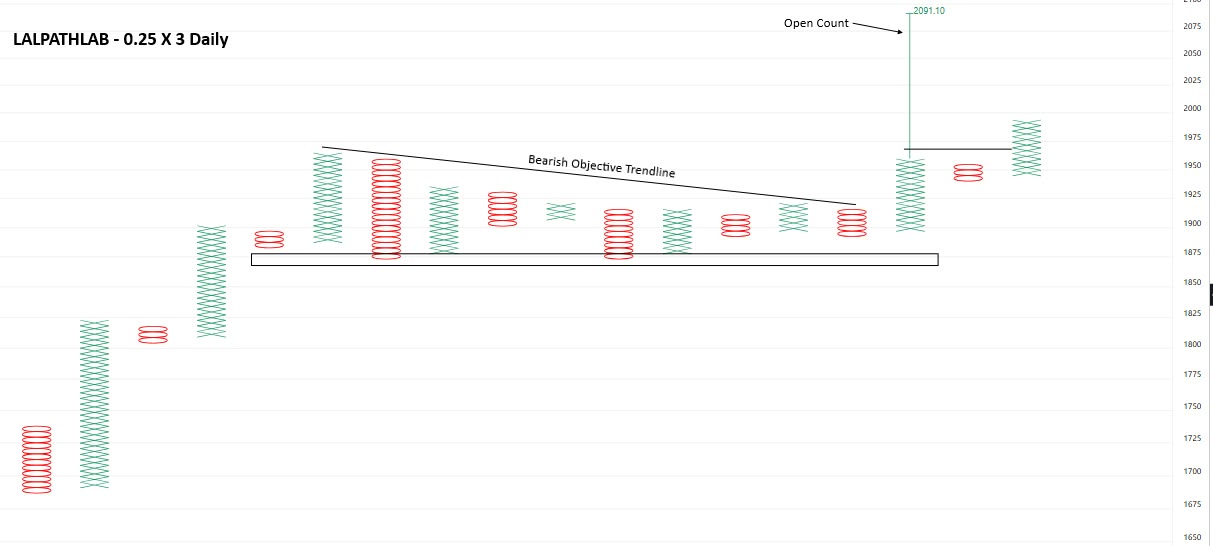
LALPATHLAB has shown a strong up move on the daily chart, rising from the 1,650–1,700 zone towards 1,975. After this rally, the stock moved into a broad consolidation between 1,855 and 1,975, indicating a healthy pause after the strong rise. The stock has now broken above the 1,975 resistance zone, suggesting a possible continuation of the bullish trend.
The Point & Figure chart (0.25% × 3) also shows a positive setup. Price consolidated for several columns above the 1,865–1,875 support zone and has now broken the Bearish Objective Trendline, which adds strength to the bullish structure. The latest column of X’s has also moved to a new high.
The Open Count projects an upside target near 2,091. As long as the stock sustains above the 1,975 breakout zone, the setup remains positive, with 2,090–2,100 becoming the next important zone to watch. A move back below the breakout zone would weaken the immediate bullish momentum.
FORCEMOT
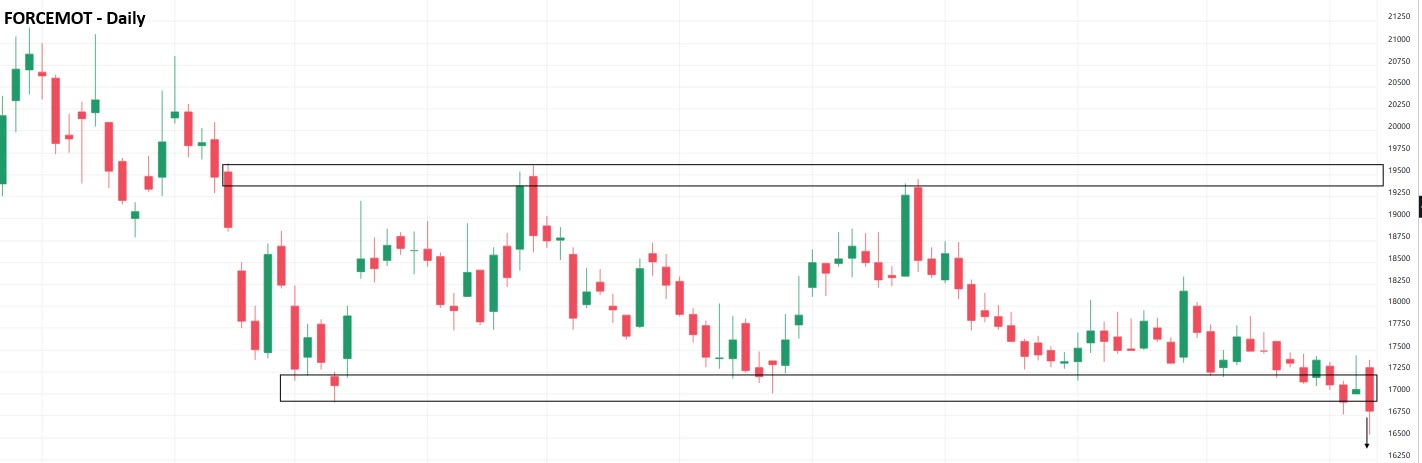
FORCEMOT has witnessed a sharp decline on the daily chart, falling from around 21,000 towards the 17,000 zone. After this fall, the stock remained in a broad consolidation range between 16,900–19,550 for a long period. The 19,250–19,550 zone acted as resistance, while 16,900–17,175 provided support multiple times. The stock has now given a decisive breakdown below this support zone, indicating further weakness.
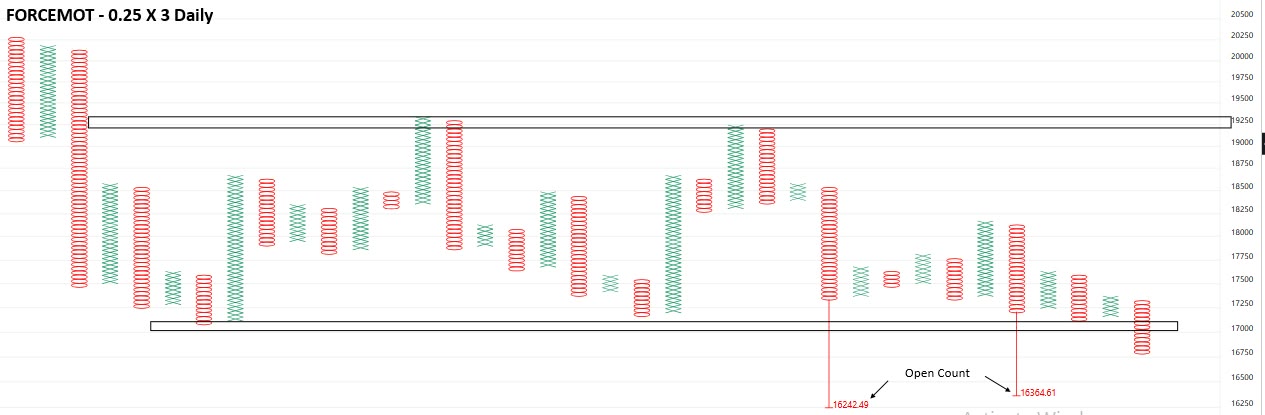
The Point & Figure chart (0.25% × 3) also supports the bearish setup. The latest column of O’s has broken below the important 17,000 support area and moved to a new low. The Open Count projects downside targets around 16,365 and 16,242. As long as the price remains below the 16,900–17,175 zone, the overall setup remains weak, with the Open Count levels becoming the next areas to watch.
Why Nifty Next 50 Could Lead the Next Market Reversal
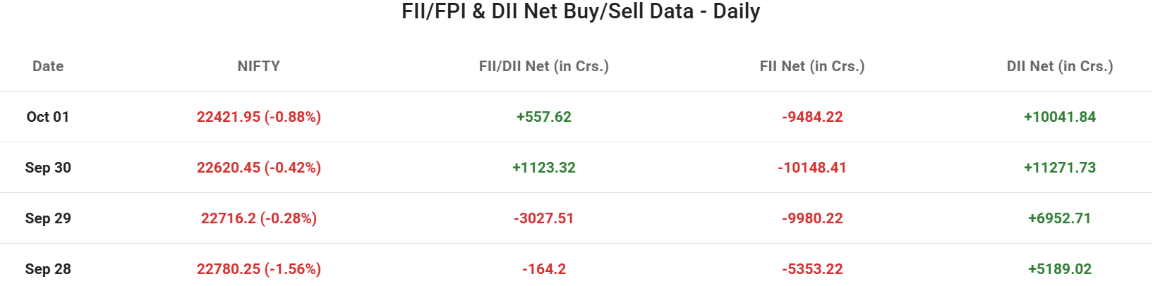
Fear has returned to Dalal Street. The Indian equity market has been under pressure, foreign institutional investors have continued to sell, crude oil and US bond yields have remained elevated, and the Nifty 50 has been witnessing a prolonged phase of weakness. On October 1, FIIs were net sellers of about ₹9,484 crore, while DIIs absorbed the selling with purchases of nearly ₹10,042 crore.
The broader market mood has understandably become cautious. In fact, the recent decline has resulted in one of the longest losing streaks for the benchmark indices in decades with straight 8 weeks of negative returns.
Fear and opportunity often appear at the same time.
Markets do not turn bullish when everyone is comfortable. Major opportunities often start developing when sentiment is weak, expectations are low and investors are already worried about what could go wrong.
One segment that deserves attention in such an environment is Nifty Next 50.
The charts suggest that if the broader Indian market finds a reversal, Nifty Next 50 could potentially participate strongly and may continue its relative outperformance against Nifty 50.
The interesting part is that this story is visible not only on the price chart but also through the Nifty Next 50/Nifty 50 ratio charts.
1. The Ratio Chart Is Already Telling a Story
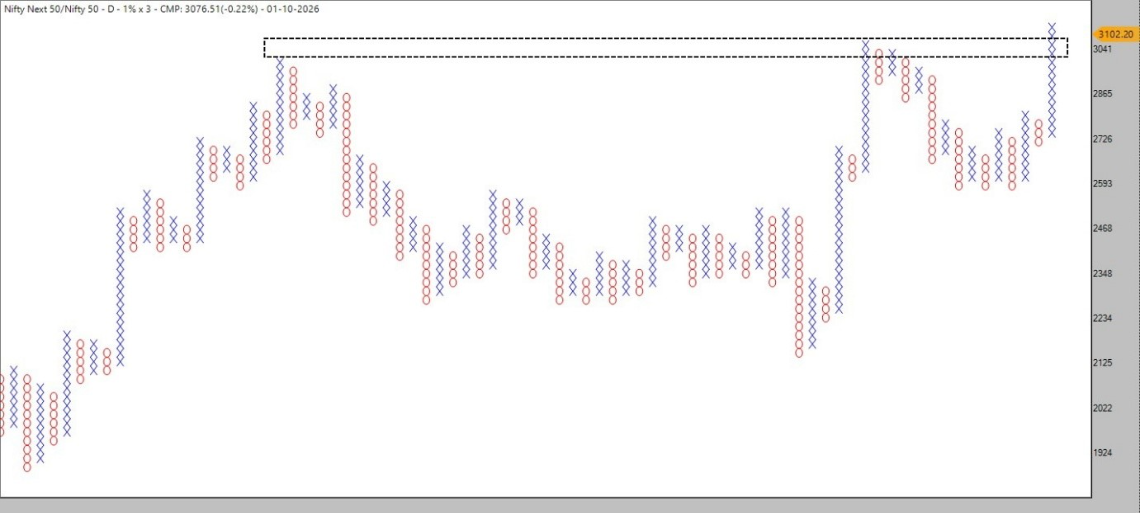
The first chart is the Nifty Next 50/Nifty 50 Daily 1% × 3 Point & Figure ratio chart.
When the ratio rises, Nifty Next 50 is gaining strength relative to Nifty 50. When it falls, Nifty 50 is doing relatively better. The most interesting development in the current chart is the breakout from the earlier resistance zone.
The ratio had spent considerable time moving sideways before pushing higher. The recent X-column has moved above the previous resistance area, indicating that relative strength has improved.
In simple language, even though the overall market is facing pressure, Nifty Next 50 has been showing the ability to hold its ground better relative to Nifty 50.
This is important because relative strength often changes before investors become comfortable with the overall market.
The ratio does not say that the market must immediately turn upward. Instead, it tells us that if a broader recovery develops, the Next 50 could be an important segment to watch.
Interestingly, the Nifty Next 50 has also shown stronger longer-term performance than Nifty 50 over several measured periods.
2. A 45-Degree Triangle: The Next Trigger
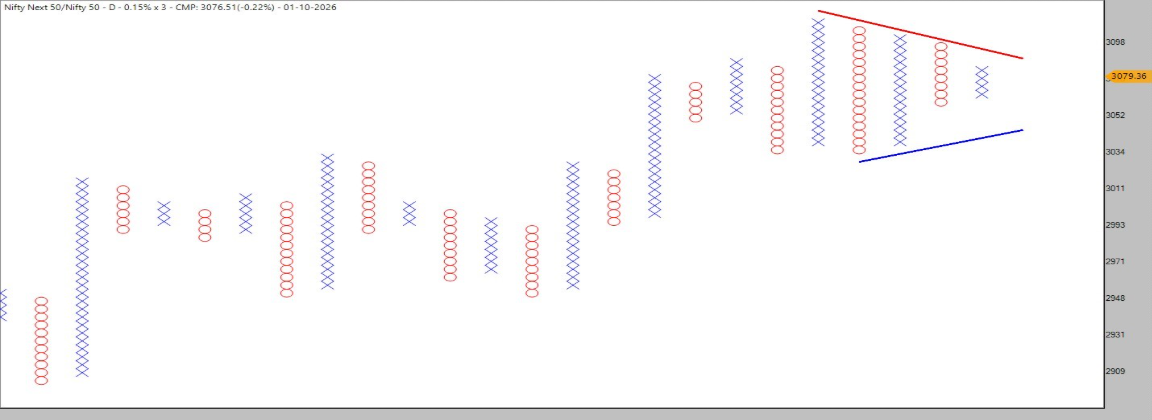
The second chart takes the ratio analysis one step further, Nifty Next 50/Nifty 50 Daily 0.15% × 3.
The finer box-size chart clearly shows a symmetrical triangle developing between a downward-sloping resistance line and an upward-sloping support line.
This creates a classic compression structure. Think of it like a spring.
The price moves between two narrowing boundaries. Buyers are willing to support the ratio at progressively higher levels, while sellers continue to appear at progressively lower levels.
That creates a battle. Eventually, one side has to win.
The approximately 45-degree symmetrical structure therefore becomes an important reference point.
A breakout above the upper trendline would indicate that buyers are gaining control in the relative-performance equation.
In other words, it would not necessarily mean that Nifty Next 50 is immediately going up in absolute terms.
Suppose both indices decline, but Nifty 50 declines 5% while Nifty Next 50 declines only 2%. The Next 50 has still demonstrated relative strength.
And if the market subsequently reverses upward, this relative strength can become even more meaningful.
Therefore, the triangle breakout in the ratio chart could become an important confirmation signal for another phase of Nifty Next 50 outperformance.
3. The Bigger Picture: Long-Term Triangle Breakout
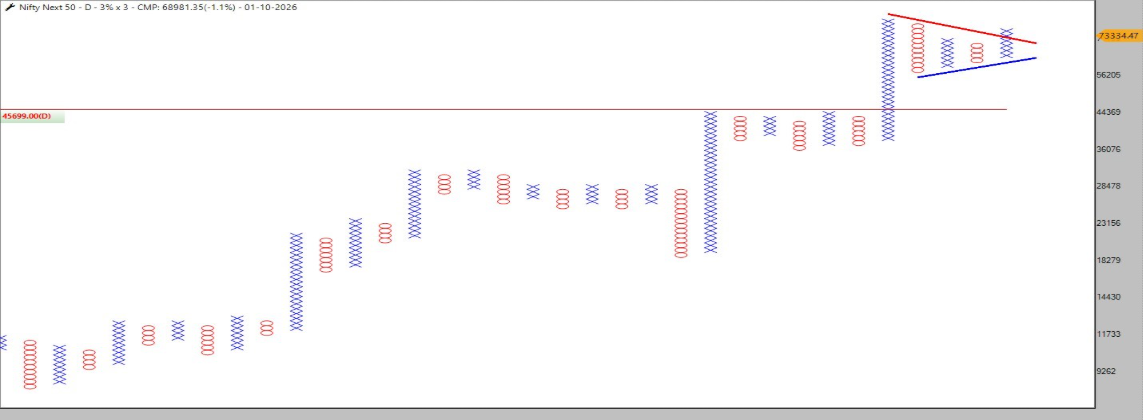
The third chart is the Nifty Next 50 Daily 3% × 3 Point & Figure chart. Here, the focus shifts away from relative performance and towards the absolute price structure.
The chart shows a large, long-term consolidation followed by a powerful upward move. More recently, the index has formed another symmetrical triangle-like consolidation near the upper end of the structure.
The important feature is that the larger structure has already witnessed an upward breakout.
This is significant because a breakout from a long-term consolidation represents a different kind of price behaviour compared with a short-term breakout.
The market has spent a considerable amount of time building this structure. Once price moves out of such a structure, the trend can potentially enter a new phase.
The current smaller triangle can therefore be viewed as a consolidation after the larger breakout.
If the upper boundary of this smaller structure is crossed decisively, it could signal that the larger trend is attempting to resume.
Fear may be dominating the headlines today. But the charts are asking investors to keep an eye on tomorrow's leadership.
The Nifty Next 50 does not need the entire market to become euphoric for its relative strength to matter. If market sentiment stabilises and the broader market begins a reversal, the combination of relative-strength improvement + triangle breakout + long-term price structure could make Nifty Next 50 an important segment to watch.
Sometimes, the next leader starts showing its strength before the crowd notices it.
FII — DII Activityy
Foreign investors remained under heavy selling pressure during the week. FIIs sold around ₹5,353 crore on Monday, 28 Sep, followed by heavy selling of around ₹9,980 crore on Tuesday and ₹10,148 crore on Wednesday. Selling continued on Thursday, 1 Oct, with FIIs offloading around ₹9,484 crore. Overall, FIIs were net sellers of around ₹34,966 crore during the four trading sessions.
Domestic institutions remained strongly supportive and consistently absorbed the selling pressure. DIIs bought around ₹5,189 crore on Monday, ₹6,953 crore on Tuesday, ₹11,272 crore on Wednesday and ₹10,042 crore on Thursday. Overall, DIIs ended the period as net buyers of around ₹33,455 crore.
Overall, FIIs remained heavy net sellers, while DIIs continued with strong and consistent buying. Nifty declined from 22,780.25 on Monday, 28 Sep, to 22,421.95 on Thursday, 1 Oct, resulting in a decline of around 1.57%. Strong DII buying provided significant support and absorbed most of the FII selling, although the combined FII/DII flow remained marginally negative at around ₹1,511 crore
FII, PRO & CLIENT POSITIONING – WEEKLY VIEW
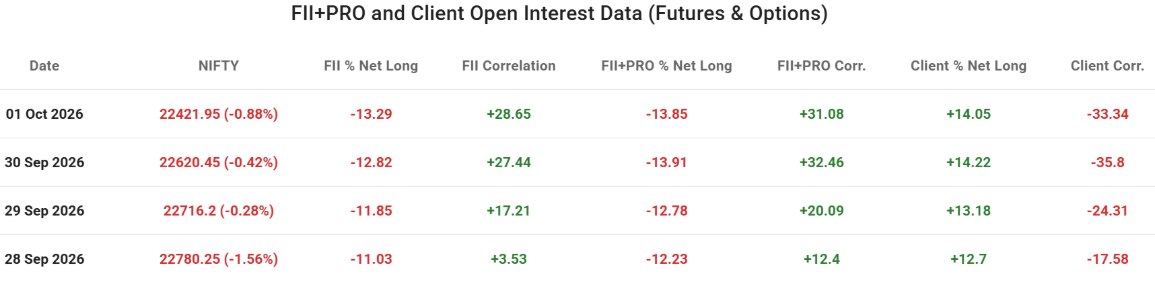
During the week, Nifty remained under pressure and closed at 22,421.95 on Thursday, 1 Oct, compared with 22,780.25 on Monday, 28 Sep, resulting in a weekly decline of around 1.57%. The index remained weak throughout the period, with declines recorded on all four trading sessions.
FII positioning weakened further during the week, with FII % Net Long declining from -11.03% on 28 Sep to -13.29% on 1 Oct. This indicates that FIIs increased their net short positioning as the market declined. At the same time, FII Correlation increased sharply from +3.53% to +28.65%, indicating a stronger positive relationship with the index.
The FII+PRO % Net Long also deteriorated, moving from -12.23% to -13.85%. This indicates that professional traders increased their net short exposure during the week. Their correlation with Nifty also strengthened significantly, rising from +12.40% to +31.08%.
Client positioning remained positive and improved slightly, with Client % Net Long increasing from +12.70% on 28 Sep to +14.05% on 1 Oct. However, Client Correlation became more negative, declining from -17.58% to -33.34%, indicating a stronger inverse relationship with the index.
Overall, FII and FII+PRO positioning became more bearish during the week, with both increasing their net short exposure. Clients, on the other hand, remained net long and slightly increased their bullish positioning. The stronger positive correlation for FIIs and FII+PRO, along with the increasingly negative client correlation, suggests that positioning remained cautious as Nifty continued to decline.
Future Open Interest Buildup
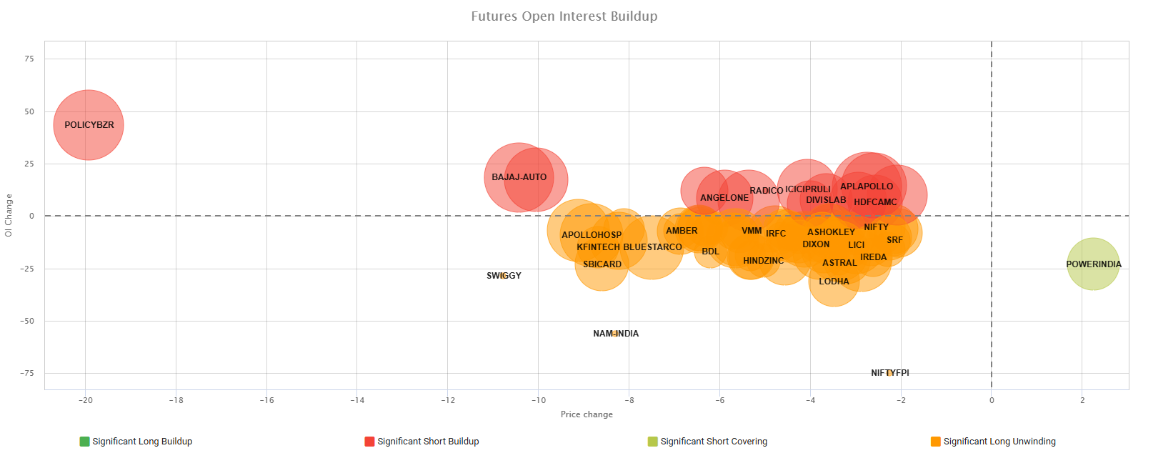
The futures market showed a largely cautious tone this week, with significant long unwinding dominating across several stocks, while fresh short buildup and selective short covering were also visible.
Stocks such as Polycab, Bajaj Auto, Angel One, Radico Khaitan, ICICI Prudential, Divi’s Labs, Apollo Hospitals, and HDFC AMC witnessed falling prices along with rising Open Interest, indicating fresh short positions.
Meanwhile, Power India witnessed short covering, as its price rose while Open Interest declined.
A large number of stocks, including Apollo Hospitals, KFin Technologies, Blue Star, SBI Cards, Amber, BDL, VMM, BSE, Hindustan Zinc, Ashok Leyland, Dixon, LICI, SAIL, Astral, IREDA, and L&T Technology Services, saw falling prices along with declining Open Interest, indicating long unwinding.
The size of each bubble represents the stock's Volume Percentile, with larger bubbles highlighting stocks that witnessed unusually high futures trading activity compared with the past year.
Overall, long unwinding remained the dominant theme, with several stocks witnessing a decline in prices along with falling Open Interest. Fresh short buildup was also visible in select counters, while limited short covering provided some pockets of strength.
India's MTF Book Crosses ₹1.5 Lakh Crore as Investors Borrow Into a Falling Market
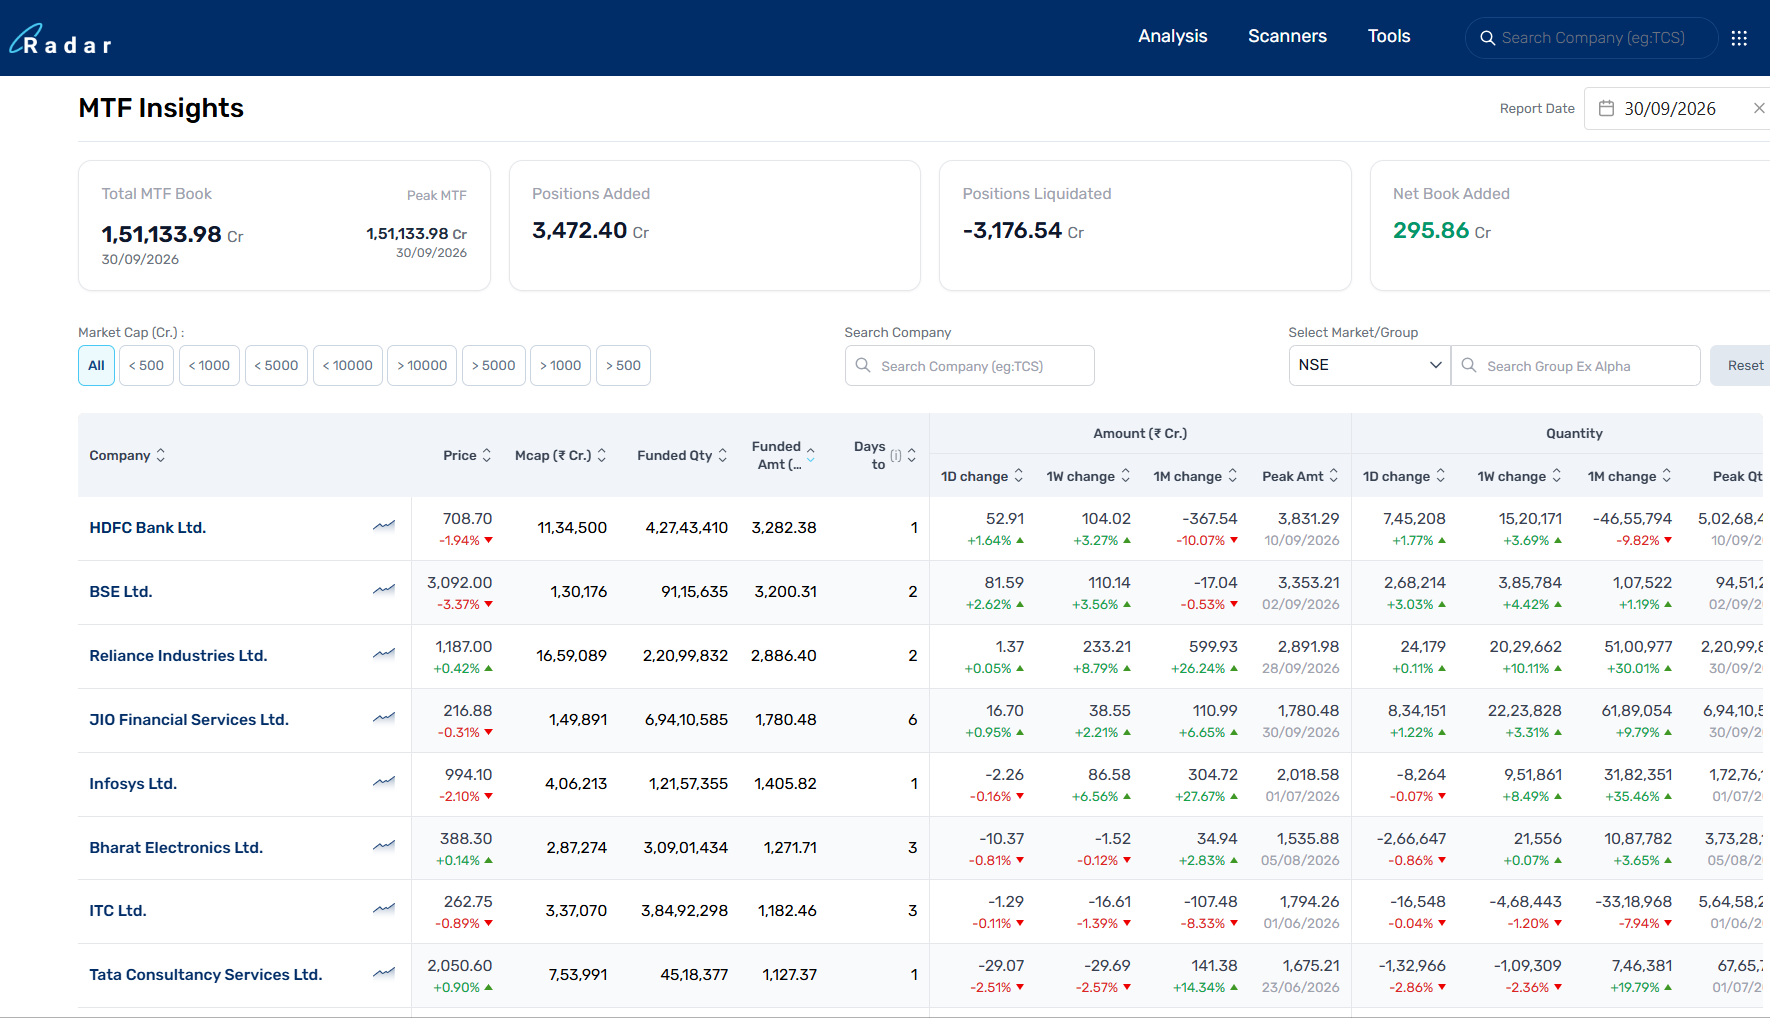
Indian investors now have more than ₹1.5 lakh crore of borrowed money invested in the stock market. This is the size of the Margin Trading Facility (MTF) book on NSE, which first went above ₹1.5 lakh crore on 24 September 2026 and reached ₹1,50,838 crore on 29 September. It is about six times what it was at the end of FY23 and about 52% higher than a year ago.
So what is MTF? It lets you buy shares by paying only part of the price yourself, while your broker lends you the rest. The shares stay in your demat account, but the broker holds them as security until you repay the loan, and charges you interest every day. If the share price falls and your own money in the trade drops too low, the broker will ask you to add more money. If you can't, the broker can sell your shares. Borrowing like this can increase your profit, but it can increase your loss too.
The surprising part is the timing. The Nifty 50 has fallen about 7% in the past year, yet the MTF book has grown by more than 50%. It took almost four years to grow from ₹23,000 crore to ₹1 lakh crore, but less than a year to add the next ₹50,000 crore. The only real dip came in February and March 2026, when the book fell about 10%. Since then it has kept rising, which suggests many investors are borrowing to buy when prices fall.
This carries risk. If the market falls sharply, many investors may be asked to add money at the same time. Those who can't will have their shares sold, which can push prices down even more. A large part of the borrowing is in mid-sized and smaller companies, which can be harder to sell quickly, and in volatile stocks like Suzlon, Vodafone Idea and Hindustan Copper.
If you use MTF, borrow only a small amount, keep spare cash ready, stick to large and easy-to-sell stocks, and remember that the interest adds to your cost every day. You can track the daily MTF numbers, including the total book and stock-wise borrowing, on the MTF Insights page of Radar by Definedge.
NIFTY NEXT 100 INDEX
The National Stock Exchange has been extremely active in launching new indices on a regular basis. The recently launched indices of interest are Nifty AI Catalysts and the Nifty Next 100.
The Nifty AI Catalysts Index tracks the performance of companies that provide critical products, services, and infrastructure that enable the AI ecosystem. The index covers key AI enabling groups such as computing, and IT infrastructure, connectivity, power and electrification, cooling systems, engineering and construction, and associated cables and materials. The weight of each stock in the index is based on its free-float market capitalization with a stock cap of 3%.
We shall focus on the other one, the Nifty Next 100 index. The Nifty Next 100 aims to track the performance of a 100-stock portfolio constructed by selecting 50 stocks from Nifty Next 50 and top 50 stocks from Nifty Midcap 150, based on their 6-month Avg. Free-float market Capitalization.
Unfortunately, both these indices are updated on an EOD basis. Hence most data vendors might not offer these indices in their charting platform. The Nifty Next 100 index appears to be an interesting one, capturing an interesting mix of large and midcap stocks. It eliminates ultra large cap stocks and includes the cream of the mid cap ones.
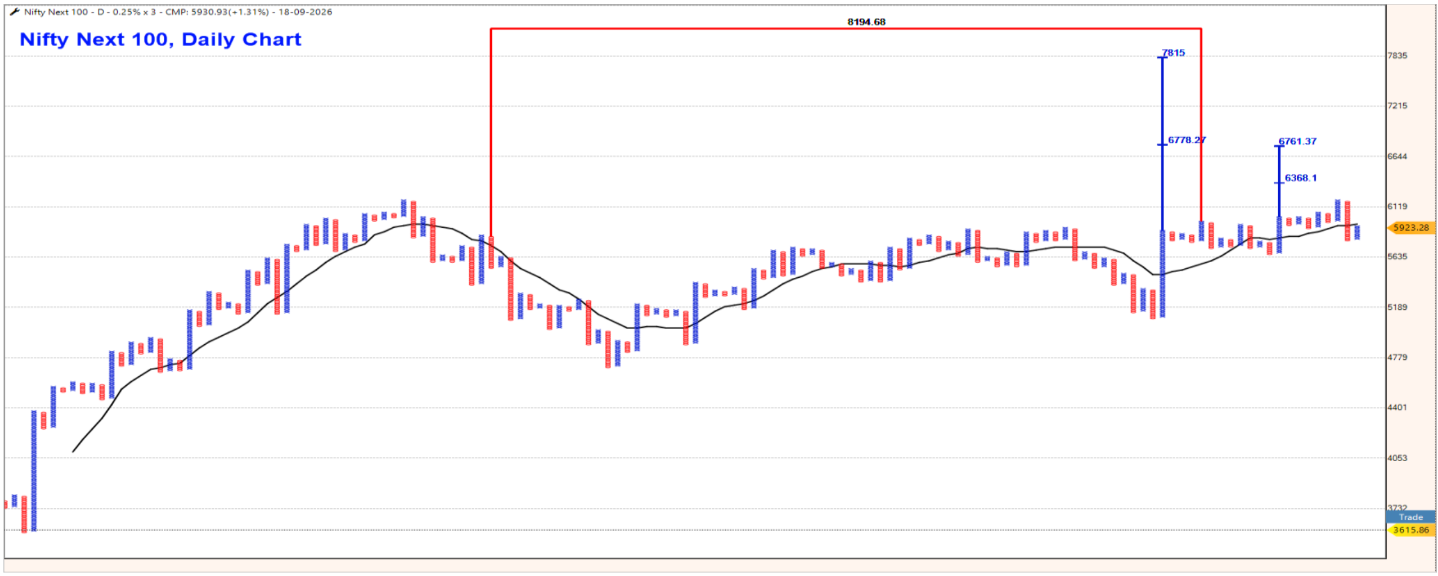
Here is the daily chart of the Nifty Next 100 index. The data for this chart was downloaded from the official NSE website.
The index has been in a prolonged period of consolidation / correction and appears set to resume its uptrend. There are open vertical and horizontal counts pointing to targets of 6,700-6,800 and 7,800-8,200.
Keep an eye on this interesting index. It is a recently launched and there are no ETFs or index funds to invest in it yet.
Wait for such offering and look to take exposures thereafter.