"Get a comprehensive snapshot of the major indices and underlying market trends to set the stage for your trading week. We analyze the broader economic landscape to give you a clear, top-down perspective on market direction. By evaluating global cues, macroeconomic data, and structural chart patterns on the Nifty and Bank Nifty, this section ensures you are never caught off-guard by shifting market sentiments."
Nifty50 Short Term View
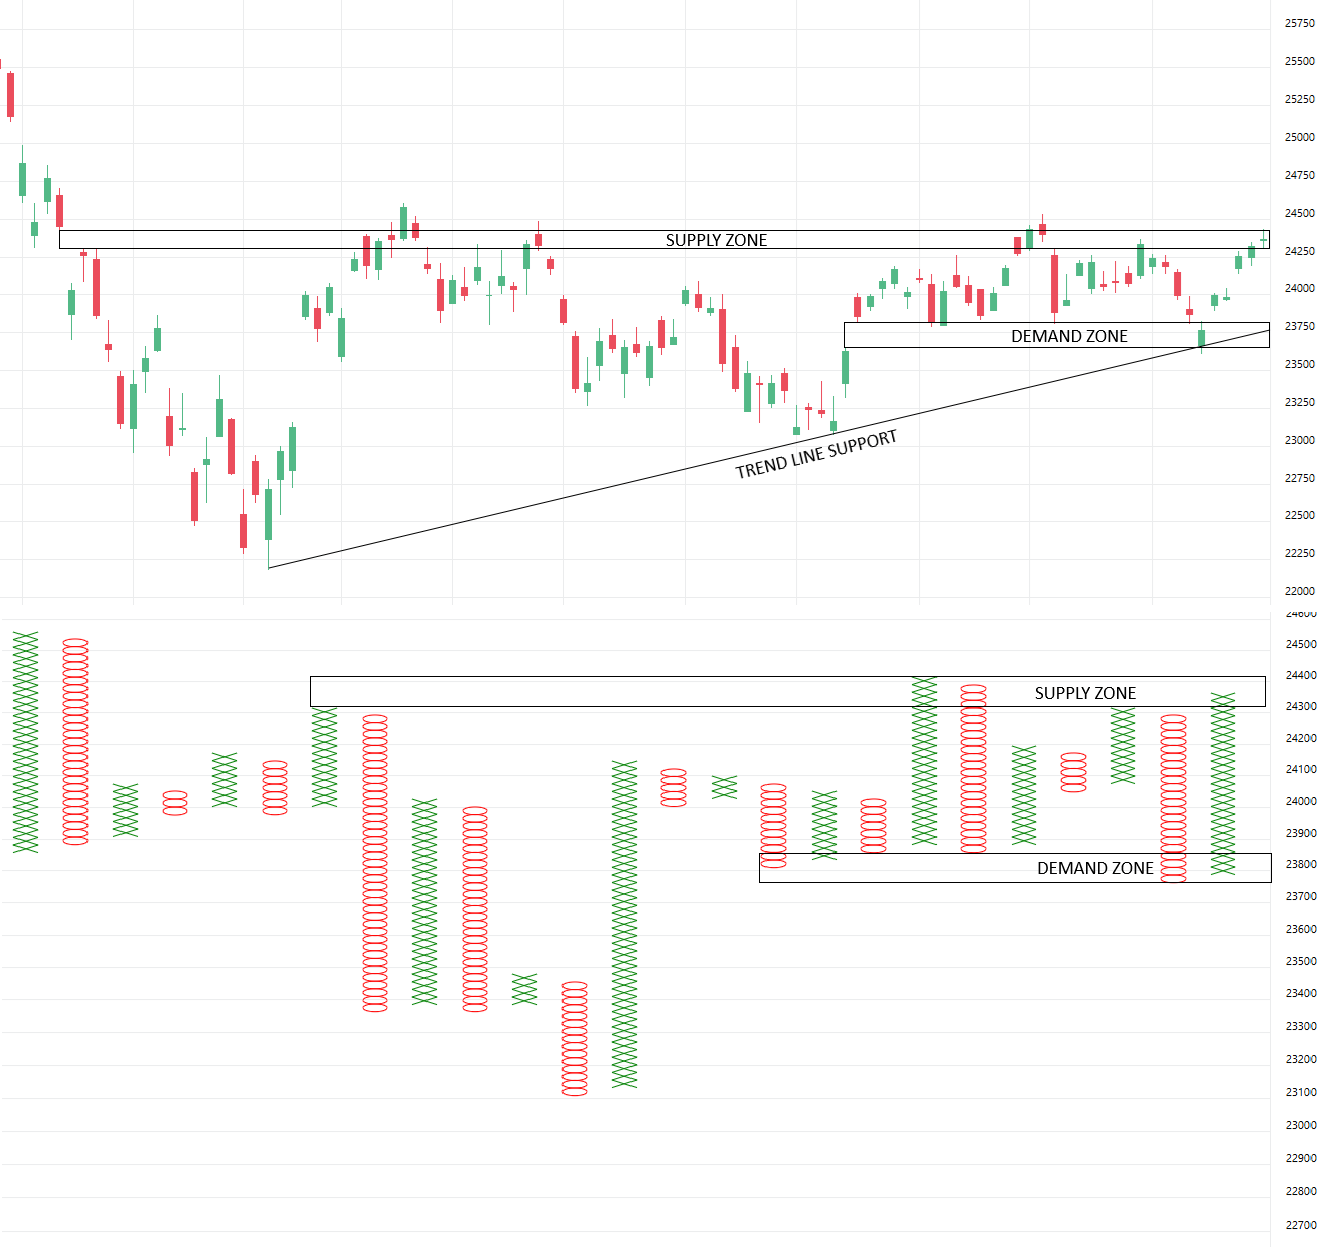
During the July series, the Nifty 50 traded mostly between 23,650 and 24,500, showing that the market remained in a sideways range without a clear trend.
The index has now closed near an important resistance zone. A strong move above the 24,500 level could improve the chances of the index moving towards the 24,600-24,850 zone. On the other hand, if the index closes below 24,000, it could indicate some weakness, with the 23,800-23,650 area becoming the next important support zone to watch.
Market breadth also remains in a neutral zone, which suggests that participation across the broader market is fairly balanced. In such an environment, breakout strategies have generally tended to perform well.
BankNifty Short Term View
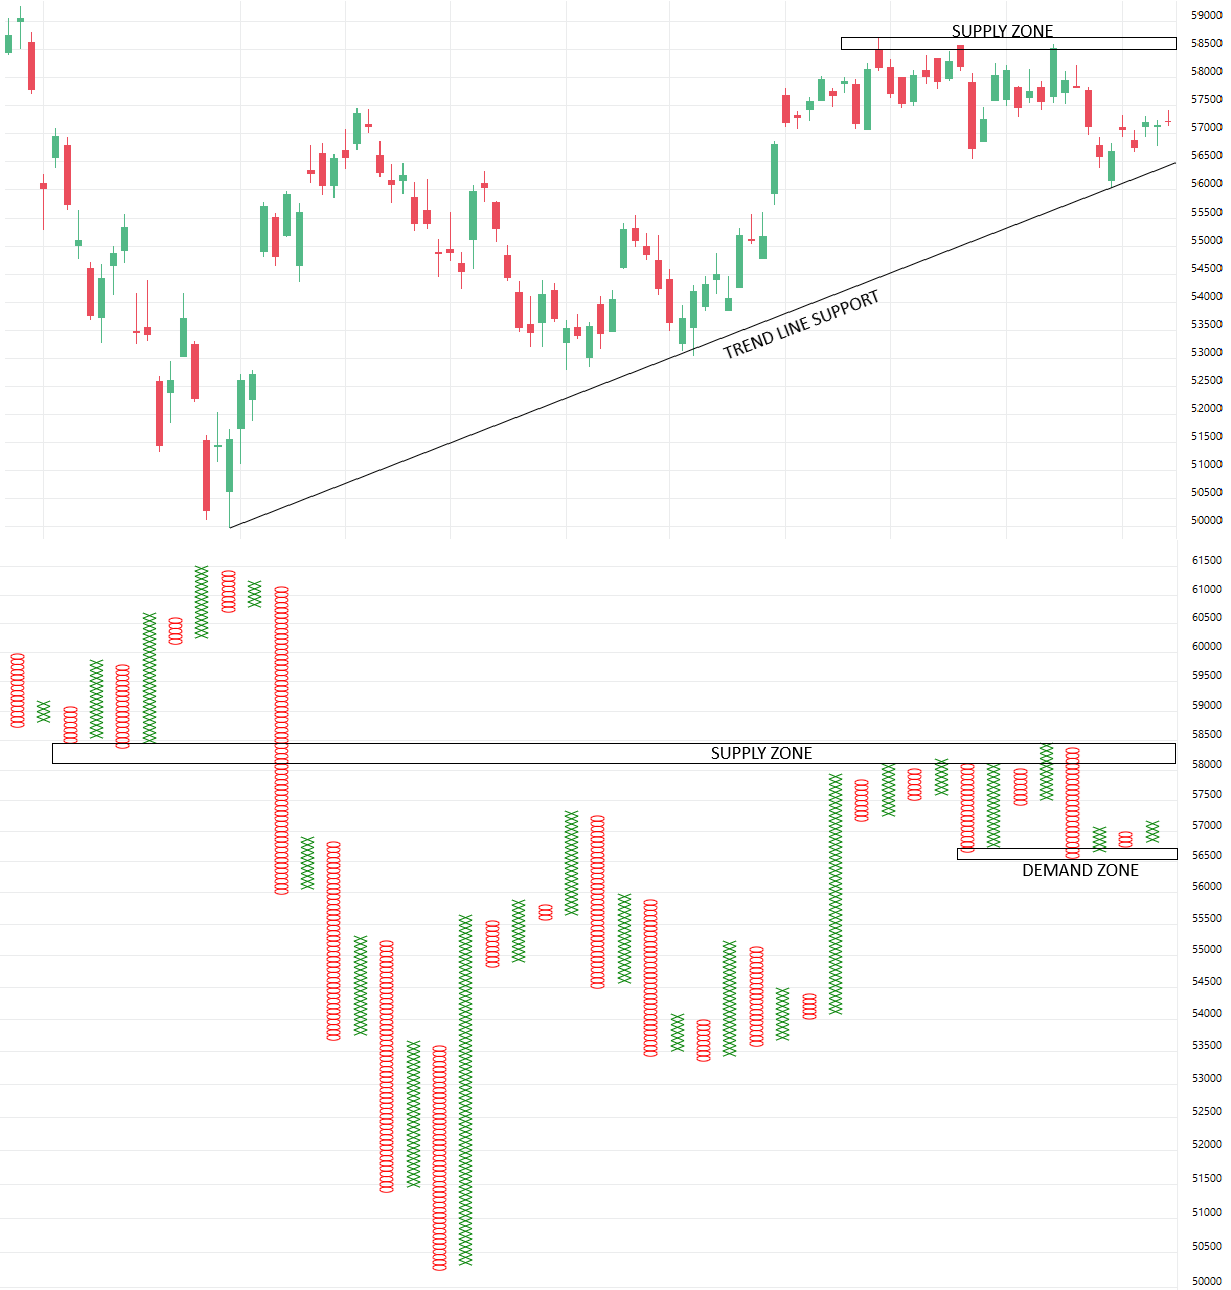
During the July series, Bank Nifty underperformed the Nifty 50. After touching a high near 58,500, the index witnessed a sharp correction of nearly 2,500 points before finding support around the 56,000 level.
Since then, Bank Nifty has recovered and moved back towards the 57,400. This makes the 56,000-56,500 zone an important support area to watch. On the upside, a strong move above the 58,500-58,700 zone could improve the chances of the index moving towards the 59,000-59,500 zone. On the other hand, if the index closes below 56,000, it could signal further weakness, with the 55,500-55,000 zone becoming the next important support zone to watch.
Market breadth also remains in a neutral zone, which suggests that participation across the broader market is fairly balanced. In such an environment, breakout strategies have generally tended to perform well.
Market Breadthh
"Analyze the underlying health of the market by tracking the ratio of advancing stocks versus declining ones. Understanding participation levels helps confirm the true strength or weakness behind daily index movements. When the index is making new highs but breadth is deteriorating, it often serves as an early warning sign of a potential reversal, allowing you to tighten your risk management proactively."
Nifty 500 Market Breadth
P&F X% Breadth
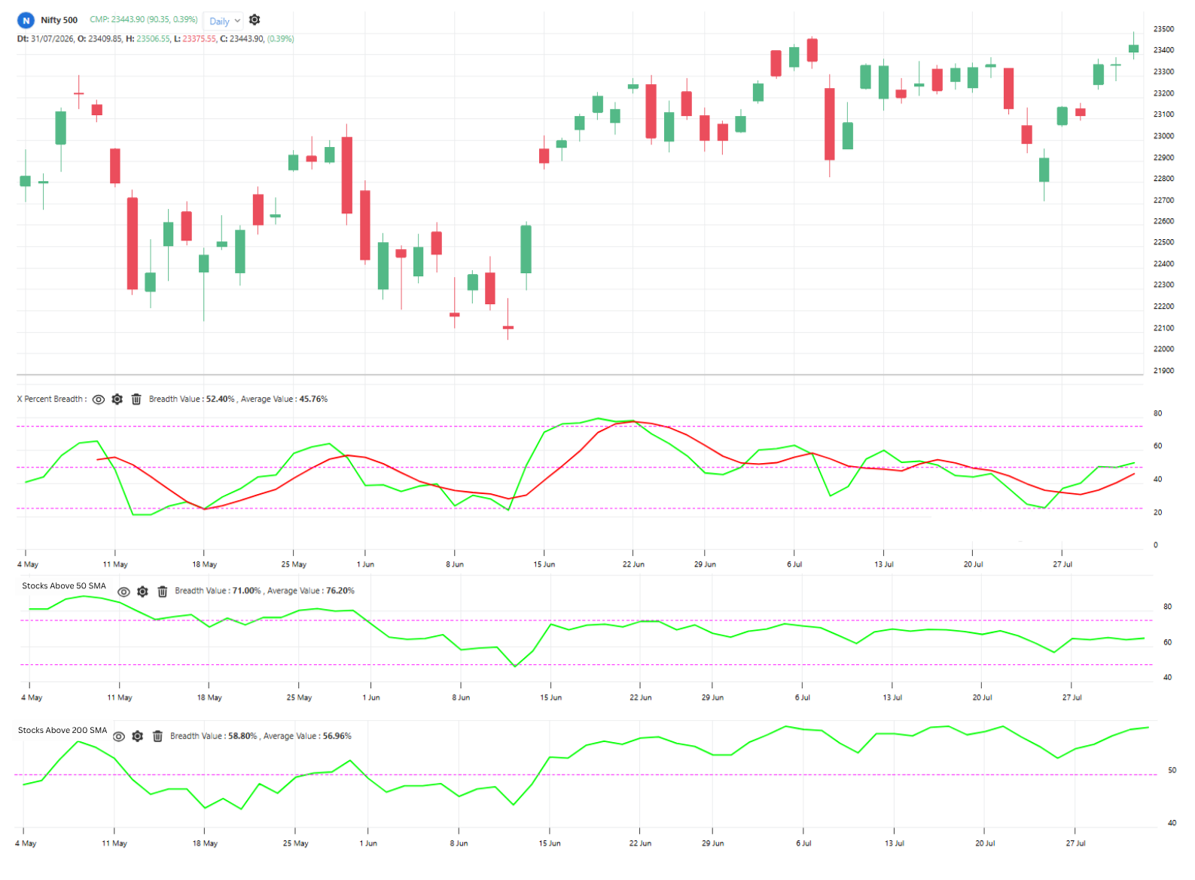
The P&F X% Breadth Indicator is currently at 52.4%, with around 262 stocks in the X column. The indicator has given a bullish crossover and is trading above its moving average, indicating improving market breadth. As long as it remains above its moving average, the broader trend remains supportive.
Stocks Above 50-Day Moving Average
The Stocks Above 50-Day Moving Average indicator is currently at 71%, with around 355 stocks trading above their 50-day moving average. The indicator shows improving medium term market participation.
Stocks Above 200-Day Moving Average
The Stocks Above 200-Day Moving Average indicator is currently at 58.80%, with around 290 stocks trading above their 200-day moving average. The indicator is in the neutral zone indicating improving long-term market participation.
Overall, the breadth indicators are in the neutral zone, but all three are trading above their moving averages, indicating improving market strength and participation. In such conditions, breakout strategies tend to work better, as improving breadth supports the overall market trend.
Relative Strength of Major Asset Classes
Nifty 50 (Top-Left Chart)
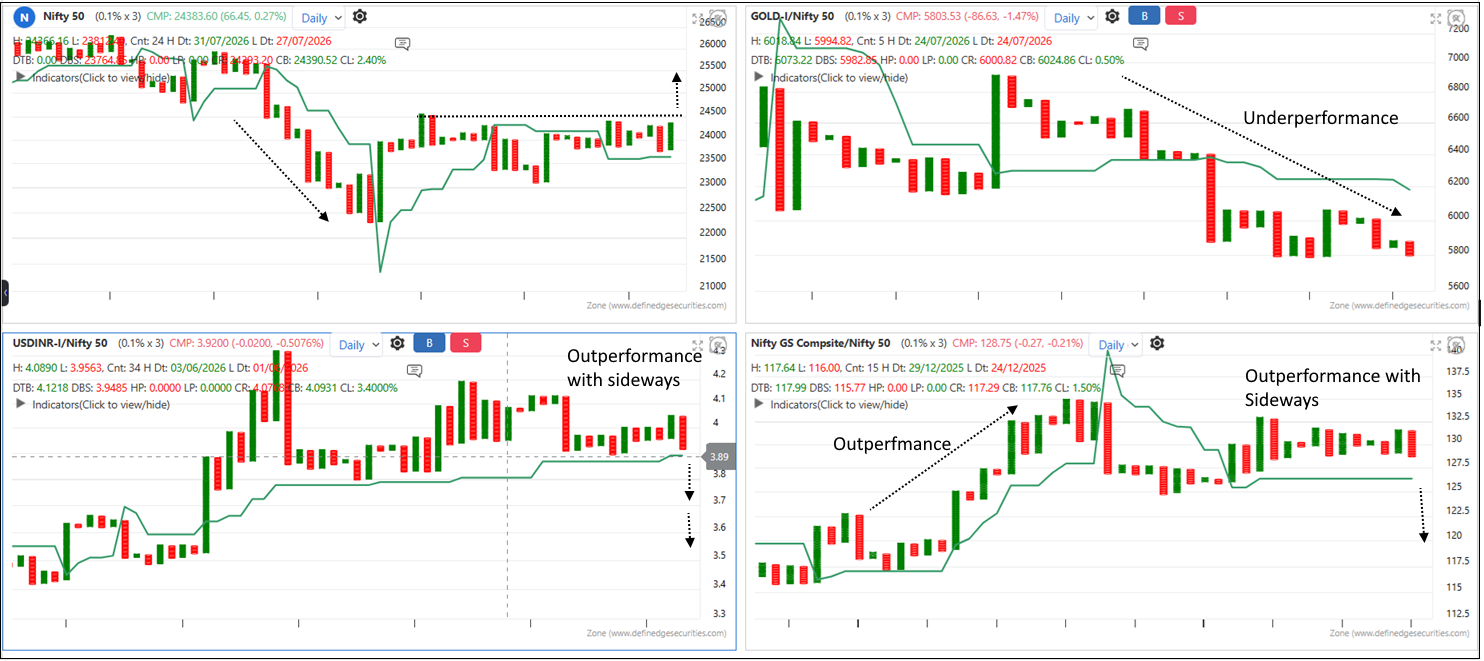
The Nifty 50 is consolidating after a sharp recovery. Although price has remained range-bound over the last few sessions, the structure remains constructive. A decisive breakout above the recent consolidation could pave the way for the next leg of the uptrend.
Gold vs Nifty 50 (Top-Right Chart)
The Gold/Nifty RS chart continues to make lower highs and lower lows, indicating persistent underperformance of Gold against equities. This suggests that market participants are currently favouring equities over defensive assets. Unless the RS trend reverses, Gold is likely to remain a laggard relative to Nifty.
USDINR vs Nifty 50 (Bottom-Left Chart)
The USDINR/Nifty RS chart remains in a strong uptrend despite recent sideways movement. This indicates that USDINR is still outperforming Nifty, but momentum has cooled after the sharp advance. A breakout from the current range would determine the next directional move.
Nifty G-Sec Composite vs Nifty 50 (Bottom-Right Chart)
The Nifty GS Composite index continues to outperform the Nifty 50. After a healthy rally, the RS chart has entered a sideways consolidation rather than showing signs of weakness. This indicates that the broader leadership remains intact and the relative strength trend is yet to reverse.
Overall, the intermarket setup remains mixed. Gold continues to underperform, while USDINR and bonds remain neutral compared to the Nifty 50. A close below the D Smart line in USDINR and Nifty G-Sec Composite would improve the outlook for equities and indicate outperformance of the Nifty 50.
Relative Strength of Broader Market Indices
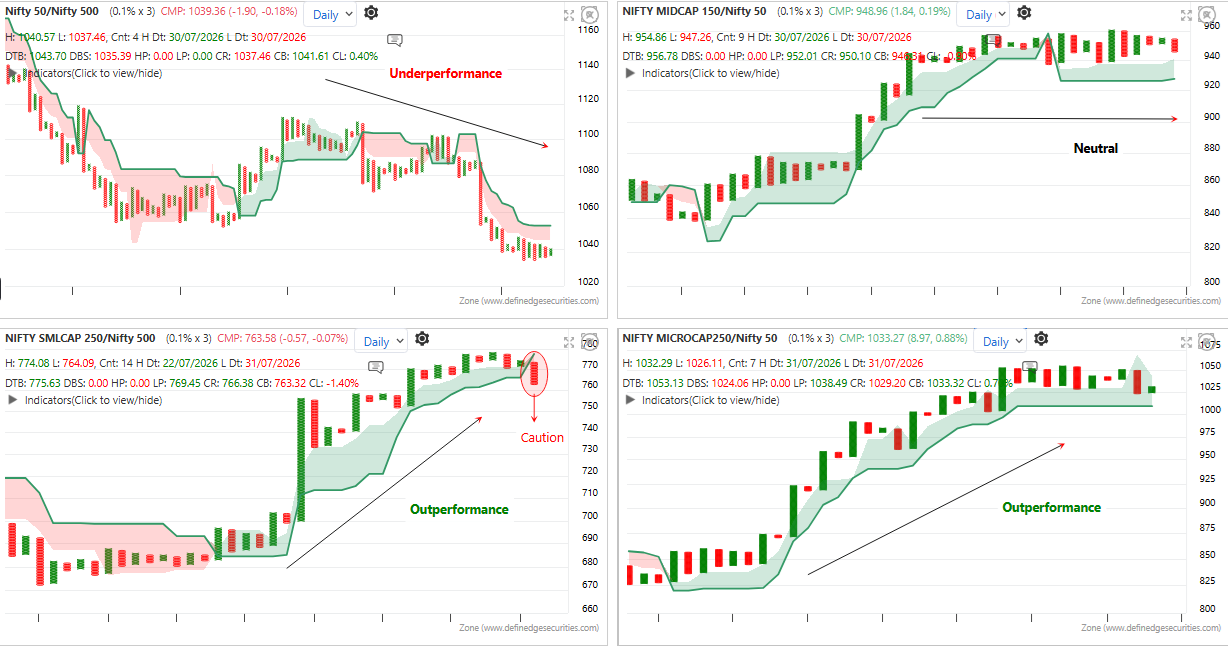
Nifty 50 / Nifty 500 (Top-Left Chart)
The RS chart of Nifty 50 vs Nifty 500 is currently in a downtrend, indicating underperformance of large-cap stocks compared to the broader market.
Nifty Midcap 150 / Nifty 500 (Top-Right Chart)
The RS chart of Nifty Midcap 150 vs Nifty 500 is currently in a sideways trend, indicating a neutral setup with no clear outperformance or underperformance.
NiftySmallcap250/Nifty500(Bottom-Left Chart)
The RS chart of Nifty Smallcap 250 vs Nifty 500 is currently in an uptrend, indicating outperformance. However, the recent setup is giving an early sign of possible underperformance, suggesting some caution at current levels.
The RS chart of Nifty Microcap 250 vs Nifty 500 is also in an uptrend, indicating continued outperformance of micro-cap stocks compared to the broader market. Overall, Smallcap 250 and Microcap 250 continue to outperform the Nifty 500, while Midcap 150 remains neutral. Nifty 50 continues to underperform, indicating that relative strength remains with the broader market segments.
Sectors On Radar
"Identify which sectors are displaying strong momentum and which are lagging to align your portfolio with current trends. We break down sectoral rotation to help you spot emerging opportunities before they become mainstream. By focusing on relative strength, you can allocate capital to the pockets of the market experiencing the heaviest institutional inflows while avoiding dead money."
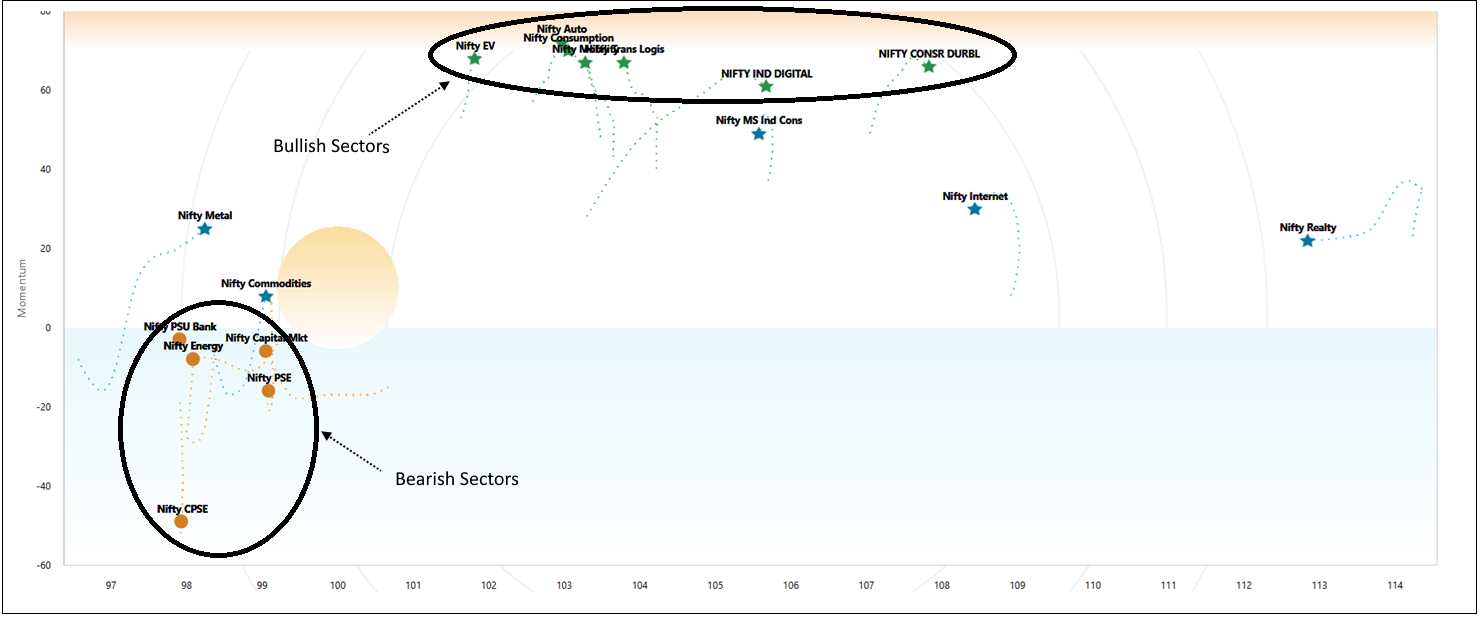
Definedge momentum and performance chart
DeMAP is divided into two parts: Sky and Water. Scrips above zero line are in Sky presented as stars. Scrips below zero line are in Water and presented as circle. You can view their last 10 session journey.
Green Star (In the Sky) stocks are bullish and have strong momentum. Red Circle (In the Water) stocks are bearish. Blue Star (In the Sky) stocks are semi-bullish and Orange Circle (In the Water) stocks are semi-bearish.
DEMAP
Strong Sectors
Sector
CMP
Change
RSI
Nifty Auto
25,432.10
+2.4%
68
Nifty EV
8,921.45
+3.1%
72
Nifty Commodities
12,410.20
+1.8%
65
Nifty Consr Durbl
34,890.75
+1.2%
61
Nifty Ind Digital
9,245.80
+4.5%
76
Weak Sectors
Sector
CMP
Change
RSI
Nifty PSE
9,876.50
-1.2%
38
Nifty CPSE
4,512.30
-2.1%
34
Nifty Energy
39,120.65
-0.8%
41
Nifty PSUBANK
7,430.25
-1.5%
36
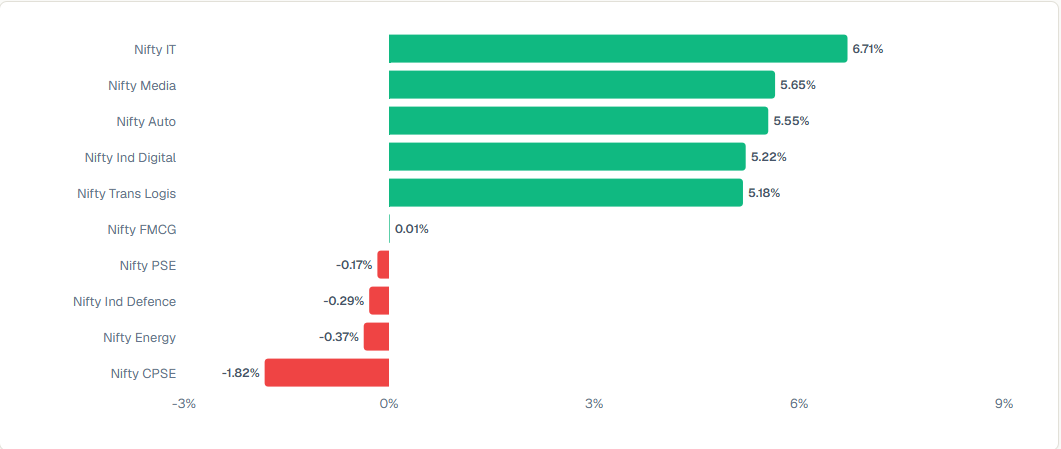
Weekly Sector Performance (26 – 31 August)
Stocks in Focuss
"Deep dive into specific stocks exhibiting compelling technical setups and strong relative performance. These are high-conviction ideas selected for their explosive breakout potential and highly favorable risk-reward ratios. We dissect the chart structure, volume footprints, and key moving averages to explain exactly why these particular names are primed for significant price action."
NIFTY 500: TOP EAGLE STOCKS
In the Tradepoint and Zone web terminals, we have developed a scanner called the Eagle scanner. It considers the price setup on multiple timeframes, relative strength, matrix scores and pattern counter scores before scoring the stock.
Below are the top 15 stocks in the Nifty 500 index based on the Eagle score.
100% Pole Follow Through - Bullish; Follow through -Bullish; Immediate Bullish AFT; Low Pole Follow Through - Bullish; Super Pattern - Bullish; Turtle Follow-Through Bullish
Key stocks currently on our radar based on technical setups
"A curated list of potential trading candidates forming actionable patterns for the upcoming sessions. Keep these names on your immediate radar as they approach key technical triggers and critical support or resistance levels. While they may not be ready for immediate execution, early identification allows you to prepare your trade plans and strike precisely when the confirmation occurs."
Scrip
Sector
Segment
Market Cap (Cr)
LCP
AETHER
Chemicals
Nifty Microcap 250
20764
1565
APARINDS
Electric Equipments
Midcap 150 Index
57782
14385
AVALON
IT - Hardware
Nifty Microcap 250
12057
1806
BAJAJHLDNG
Finance - Housing - NBFC
Nifty Next 50 Index
126151
11335
CONCORDBIO
Pharma
SmallCap 250
14839
1418.5
GAIL
Oil - Gas
Nifty Next 50 Index
119140
181.2
HYUNDAI
Auto
Nifty Next 50 Index
177377
2183
SONATSOFTW
IT - Software
SmallCap 250
8987
320.5
VARROC
Auto Ancillary
Nifty Microcap 250
10404
681
WEWORK
Trading
Nifty Microcap 250
10139
749
FII — DII Activityy
"Track the flow of institutional money to understand exactly where the 'smart money' is positioning themselves. By monitoring FII and DII data, we gain crucial insights into the underlying institutional conviction driving the markets. Consistent buying or selling pressure from these heavyweight participants often dictates the intermediate-term trend."
FII/FPI & DII Net Buy/Sell Data - Daily
Date
NIFTY
FII/DII Net (in Crs.)
FII Net (in Crs.)
DII Net (in Crs.)
Jul 31
24383.6 (+0.27%)
+2537.85
+277.48
+2260.37
Jul 30
24317.15 (+0.28%)
+1759.48
+3623.51
-1864.03
Jul 29
24250.2 (+1.1%)
+3979.89
+2981.87
+998.02
Jul 28
23985.35 (-0.04%)
+2419.49
+755.33
+1664.16
Jul 27
23995.95 (+0.96%)
+640.91
-1688.23
+2329.14
Foreign investors made a strong comeback this week after staying on the selling side for the past few sessions. They started the week by selling around ₹1,700 crore on Monday, but the mood changed quickly. On Tuesday, FIIs turned buyers with purchases of around ₹755 crore. Their buying picked up further on Wednesday, when they bought nearly ₹3,000 crore, and remained strong on Thursday with buying of over ₹3,600 crore. Although buying slowed on Friday, FIIs still remained net buyers. Overall, they bought shares worth around ₹6,000 crore during the week, showing a clear improvement in sentiment.
Domestic institutions also continued to support the market. They bought shares on Monday ₹2,330 crore, Tuesday ₹1,660 crore, and Wednesday ₹1,000 crore. They were the only sellers on Thursday, booking profits of around ₹1,860 crore, but returned as buyers on Friday with purchases of nearly ₹2,260 crore. Overall, DIIs remained net buyers of around ₹5,400 crore for the week.
The biggest positive this week was that both FIIs and DIIs ended as net buyers. Domestic investors continued to provide steady support, while the return of FII buying in the second half of the week added fresh confidence and helped keep the market on a positive footing.
FII, PRO & Client positioning – weekly view
FII+PRO and Client Stock Open Interest Data
Date
NIFTY
FII % Net Long
FII+PRO % Net Long
Client % Net Long
DII % Net Long
31 Jul 2026
24383.6 (+0.27%)
+3.76
+3.86
+31.62
-35.48
30 Jul 2026
24317.15 (+0.28%)
+3.18
+2.92
+31.37
-34.3
29 Jul 2026
24250.2 (+1.1%)
+2.6
+1.88
+30.84
-32.73
28 Jul 2026
23985.35 (-0.04%)
+1.89
+0.58
+30.24
-30.82
27 Jul 2026
23995.95 (+0.96%)
+1.26
-0.57
+29.27
-28.7
FII positioning improved gradually throughout the week, with FII % Net Long rising from +1.26% on 27 July to +3.76% on 31 July, indicating a slightly more bullish stance.
The FII+PRO % Net Long data also showed a notable improvement. After remaining in negative territory for most of the week, it moved into positive territory and ended at +3.86%, suggesting that professional traders turned more optimistic towards the end of the week.
Client positioning remained consistently bullish, with Client % Net Long increasing from 29.27% to 31.62%. On the other hand, DII % Net Long stayed negative throughout the week, falling further from -28.70% to -35.48%, reflecting continued defensive positioning.
Overall, FII and PRO sentiment improved during the week, while clients remained strongly bullish. The positive shift in institutional positioning, along with the market's recovery, suggests an improvement in short-term market sentiment.
During the week, Nifty remained positive and ended near the week's high, closing at 24,383.6 on 31 July with a weekly gain of around 2.59%.
Stocks for the Weekk
Key technical setups and positional views
"Our top hand-picked stock recommendations based on rigorous technical and quantitative analysis. We provide precise structural insights, entry triggers, and invalidation levels to help you execute these setups with maximum confidence. Each recommendation is backed by a logical thesis, ensuring you understand the 'why' behind the trade rather than just blindly following a ticker."
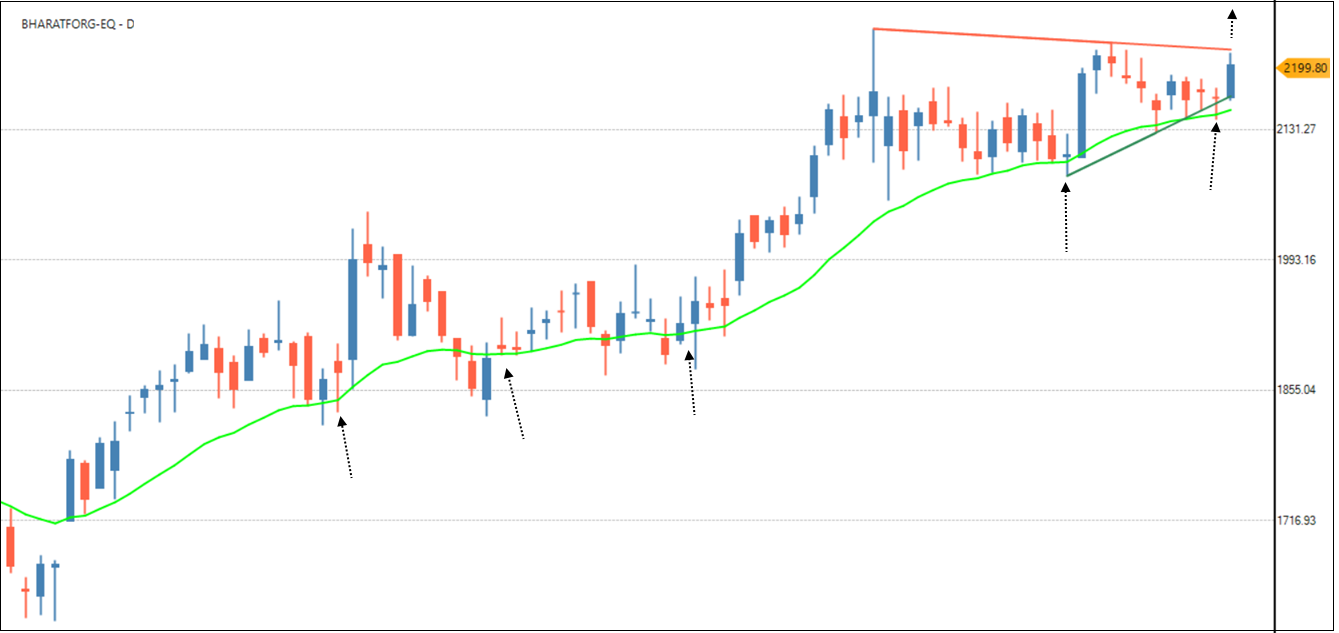
BHARATFORGE
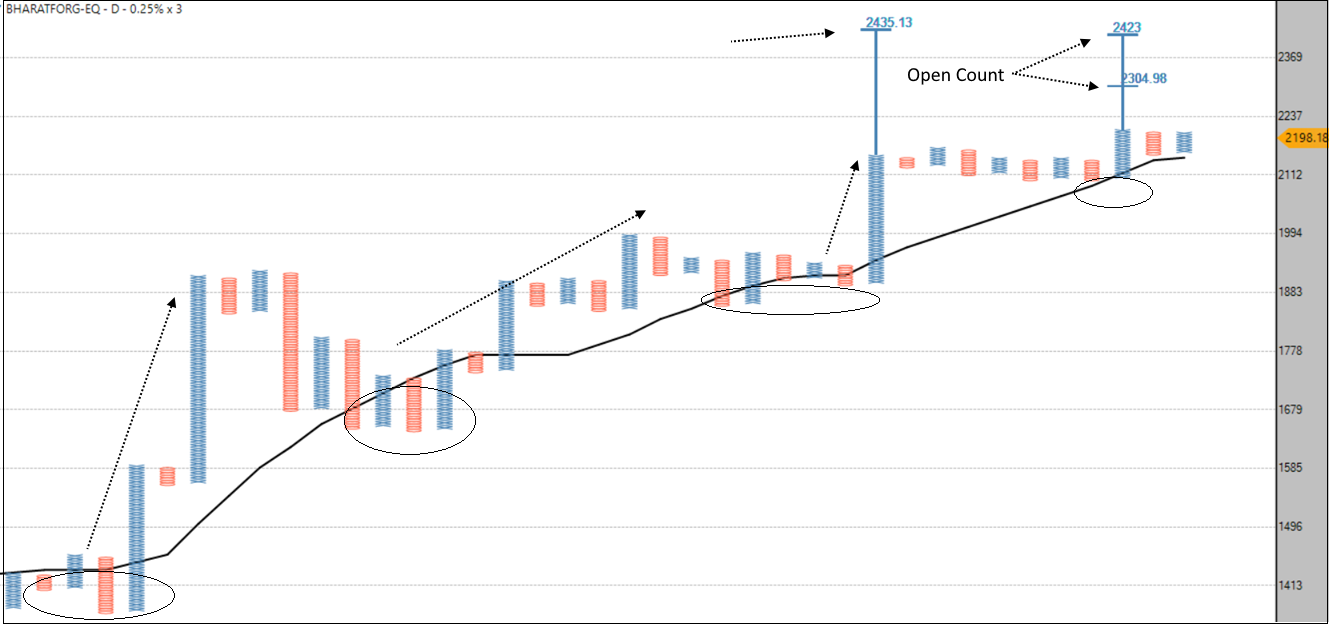
Bharat Forge continues to trade in a well-defined uptrend, with price consistently finding support near the rising moving average. Each pullback has been shallow, reflecting sustained buying interest.
The Point & Figure chart also supports the bullish structure. Price is holding above the rising trend line, while the Open Count projects upside potential towards 2305 and 2423. As long as the stock sustains above the recent swing support, the broader trend remains positive, and any dips may continue to offer buying opportunities.
MFSL
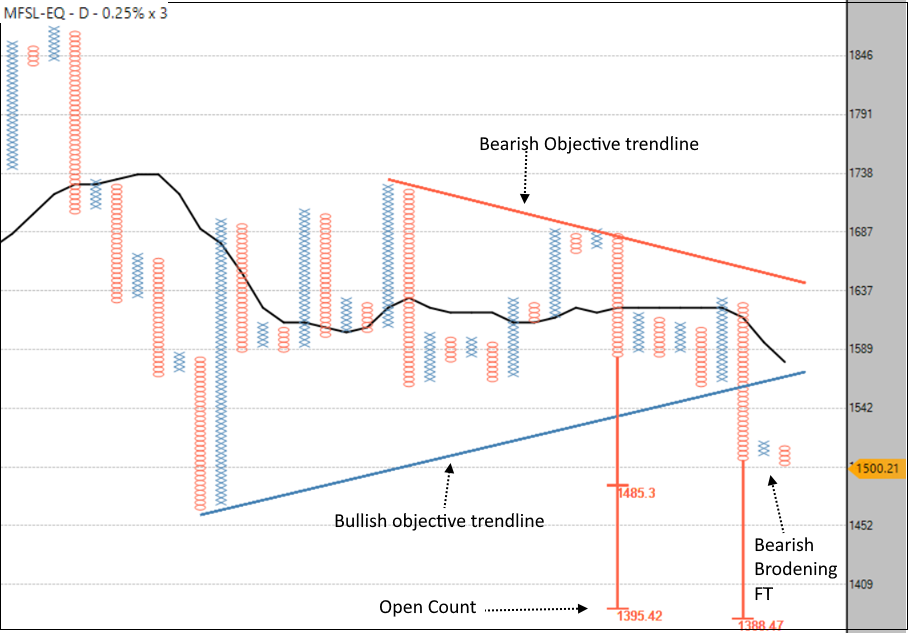
The Point & Figure (P&F) chart continues to display a bearish structure, with price trading below the bearish objective trendline while remaining unable to establish a meaningful recovery. The recent Bearish Broadening follow through signals increasing downside pressure, with the bearish price objective projected near 1,388. The open count also supports a negative bias, indicating that sellers remain in control.
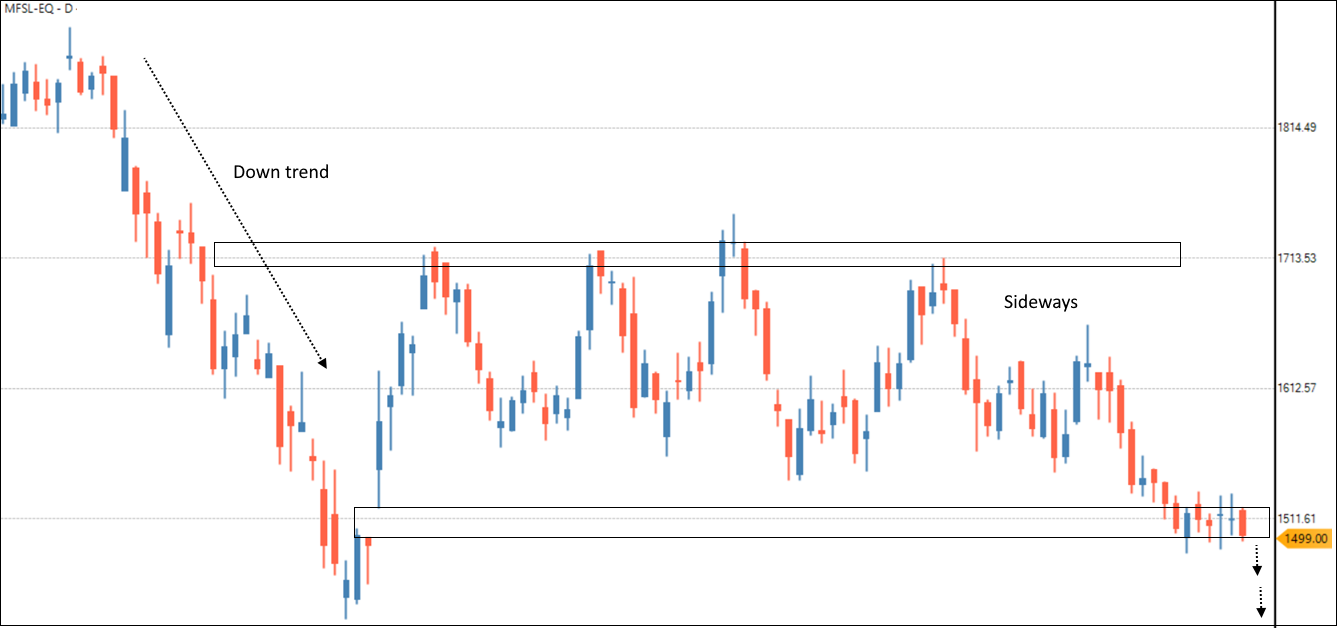
The corresponding candlestick chart reinforces this outlook. After a prolonged downtrend, the stock entered a sideways consolidation between well-defined support and resistance levels. Price has now drifted toward the lower boundary of the range, and a decisive breakdown below support could trigger a fresh leg lower. Unless the price reclaims the upper resistance zone, the overall trend is expected to remain bearish, with downside risks outweighing upside potential.
Any close below 1500 may lead to further selling pressure till 1485,1395. Pattern will fail once price close above 1520.
Futures Open Interest Buildupp
Long buildup vs short buildup and positioning
"Gauge the speculative sentiment by analyzing the buildup of long and short positions in the derivatives market. Open interest data provides a transparent window into the conviction of futures traders across major indices and stock-specific contracts. Significant shifts in OI, especially when combined with price action, can act as a powerful leading indicator for impending breakouts or trend exhaustion."
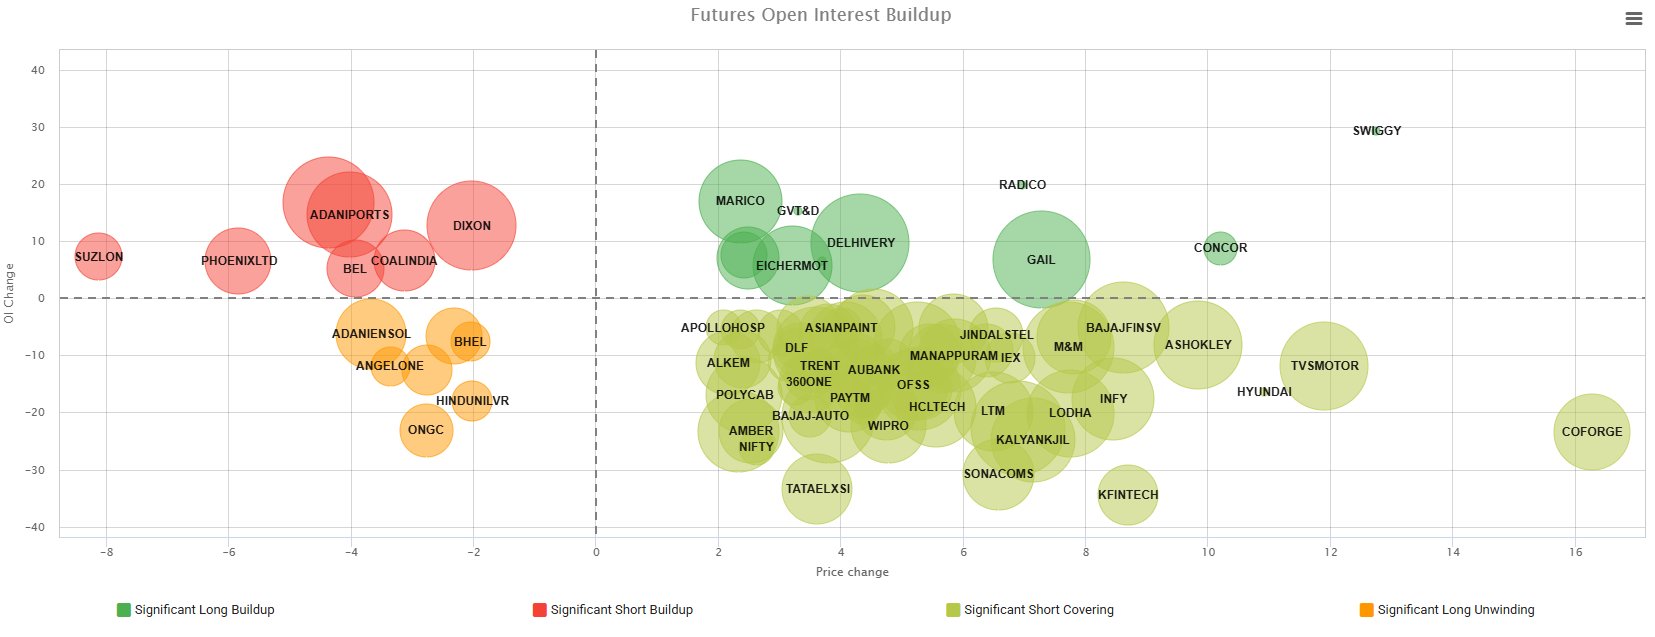
The futures market showed a mixed undertone this week, with selective long buildup alongside continued short covering across several stocks. Stocks such as Marico, Delhivery, GAIL, Radico Khaitan, CONCOR, and Eicher Motors witnessed a combination of rising prices and increasing Open Interest, indicating fresh long positions being created.
On the other hand, TVS Motor, Coforge, Bajaj Finserv, Infosys, LTIMindtree, and M&M saw prices rise while Open Interest declined, suggesting short covering as traders closed existing bearish positions.
Significant short buildup was visible in stocks including Adani Ports, Dixon Technologies, BEL, Coal India, Phoenix Mills, and Suzlon, where prices declined even as Open Interest increased, reflecting fresh bearish bets. Meanwhile, ONGC, Hindustan Unilever, BHEL, Adani Energy Solutions, and Angel One witnessed long unwinding, indicating that existing long positions were being closed.
The size of each bubble represents the stock's Volume Percentile, with larger bubbles highlighting stocks that witnessed unusually high futures trading activity over the past year.
Overall, the week's positioning was relatively balanced, with selective buying and short covering offsetting fresh bearish positions in a few key stocks.
Weekly Result Calendar
Key earnings announcements to watch out for this week
"Stay ahead of the curve with our comprehensive schedule of upcoming corporate earnings announcements. Anticipating fundamental catalysts is key to managing volatility and positioning for post-earnings momentum. By knowing exactly when key companies are reporting, you can adjust your options strategies and avoid holding unhedged positions through unpredictable event risks."
Mid-cap businesses with strong fundamentals and consistent earnings momentum
"Leverage our proprietary scanners to unearth hidden gems exhibiting strong growth and technical characteristics. These mid-cap companies possess the foundational strength required for sustained, long-term outperformance. We filter out the noise to bring you high-quality businesses that are currently forming structurally bullish patterns, offering a perfect blend of fundamental quality and technical timing."
Looking for mid-cap businesses with strong fundamentals and consistent earnings momentum? This Radar scanner helps you discover companies that are delivering robust sales and profit growth while maintaining healthy promoter confidence.
This scanner identifies companies that satisfy the following conditions:
Quarterly Sales Growth: Quarterly sales are at least 15% higher than both the previous quarter and the same quarter last year.
Quarterly EPS Growth: Quarterly EPS has increased by at least 15% compared to both the previous quarter and the same quarter last year.
Sequential Growth: Both Quarter-on-Quarter (QoQ) Sales Growth and Net Profit Growth exceed 15%.
Market Capitalization: Companies with a market capitalization between ₹20,000 Cr and ₹1,00,000 Cr.