
Issue #1 · 24 JUL 2026

Weekly Newletter 24th July 2026

Market overview

NIFTY50 SHORT TERM VIEW
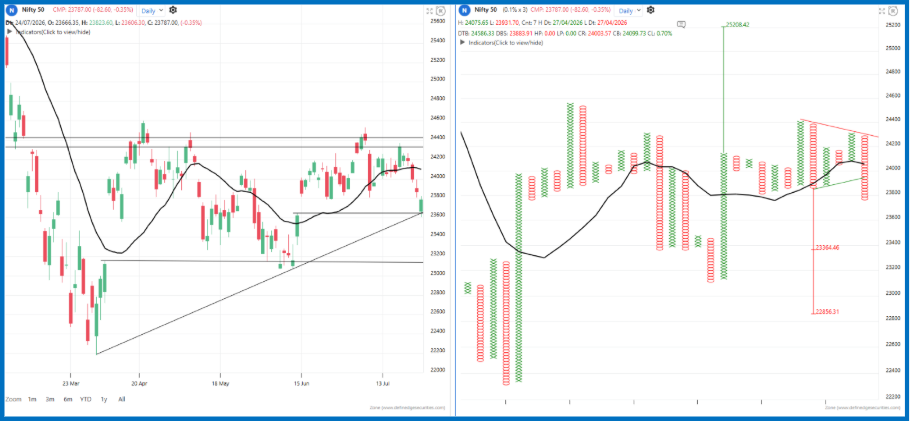
The current price structure in Nifty 50 is indicating a Bearish ABC pattern along with bull trap on the Point & Figure chart. Additionally, price is trading below the 10-column moving average, which keeps the broader setup Bearish. Currently, Nifty has formed a Bearish anchor column and is trading below the bullish 45-degree trendline. Any Bearish follow-through pattern from here could offer a favourable risk-to-reward opportunity. However, breaking above the bearish 45-degree trendline is important for further upside.  

On the breadth front, the X% Breadth Indicator is currently around 34%, indicating that 17 out of 50 stocks are in bullish columns. In such an environment, breakout strategies tend to perform well. If the price moves above 24,600, the downside open count will be negated, On the other hand, if the price falls below 23,100, the upside open count will be negated.   Levels to watch:  Immediate Resistance: 24,300 –24,400  Immediate Support: 23,500 –23,600  

BANKNIFTY SHORT TERM VIEW 
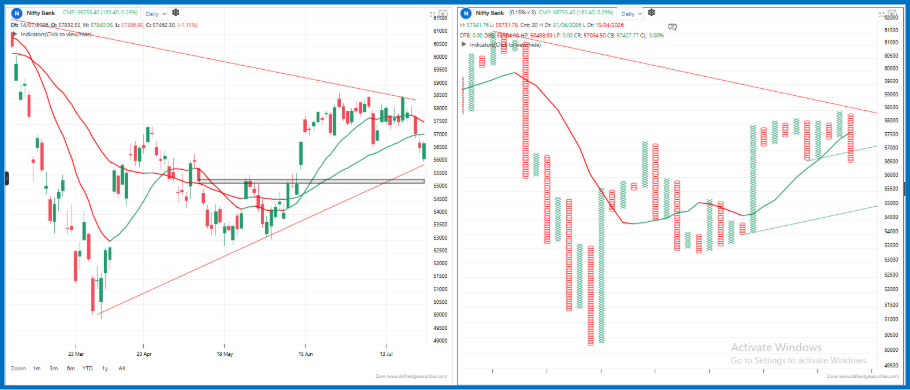
Bank Nifty has faced resistance at the Bearish Objective Trendline and has been under selling pressure since then. It has also formed a Bull Trap and is now trading below its important support level of 57,600 and below its 10 SMA, indicating that the short-term trend has turned bearish.  

The index needs to close above 57,600 and the Bearish Objective Trendline to regain positive momentum, with the open Vertical Count indicating a potential upside target of 59,000. On the downside, the 56,100–52,600 zone remains a key support area. A breakdown below this zone could lead to the downside Open Count targets of 55,300 and 53,900, while the 45-degree Objective Trendline near 54,900 may act as an important support. 

The X% Breadth Indicator has declined from 71% last week to 45% currently, with only 7 banking stocks remaining in X columns. The indicator has also given a bearish crossover below its moving average, suggesting that Bank Nifty may remain weak or continue to consolidate in the coming week. 

Key levels to Watch. 

Resistance - 57,500 - 57,600 

Support - 55,900 - 56,000 
Market breadth

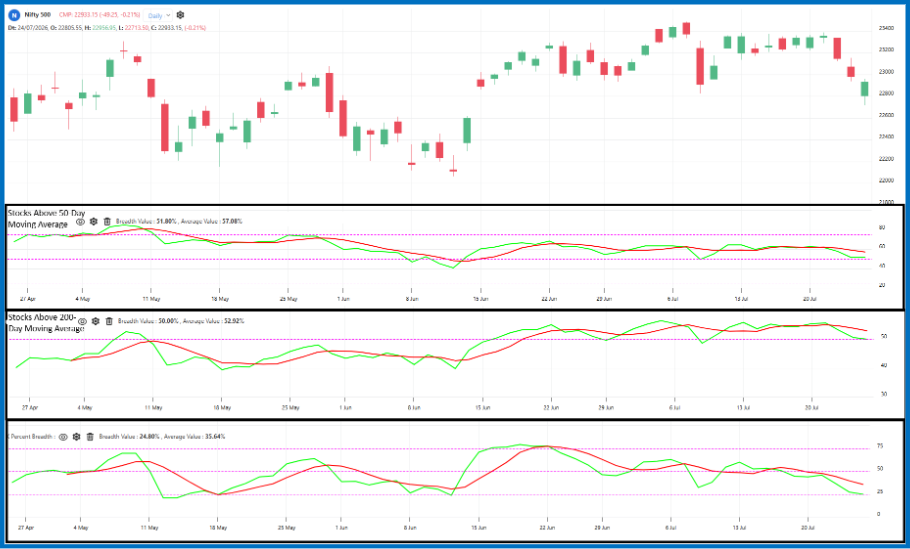
Nifty 500 Market Breadth 

Overall: The broader market continues to show underlying strength, with participation remaining healthy across stocks. Continued improvement in breadth indicators would further strengthen the overall market outlook. 

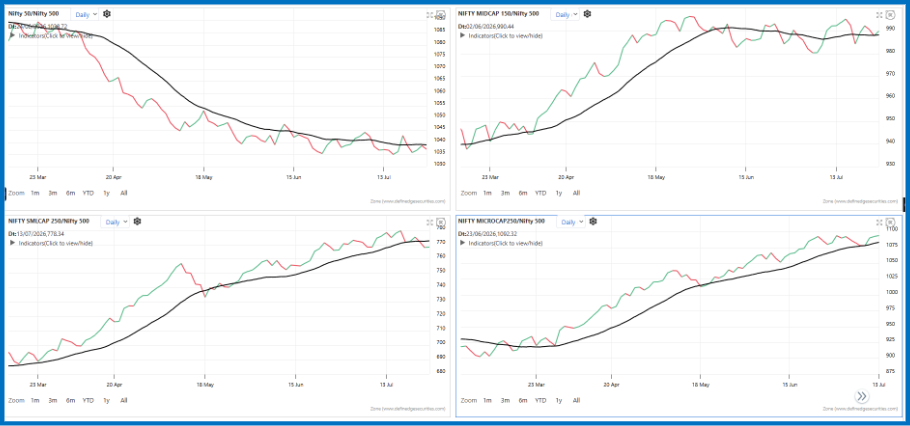
Relative Strength of Broader Market Indices

Relative Strength of Broader Market Indices 

Index 

Relative Trend 

Index 

Relative Trend 

Nifty 50 

Bearish 

Nifty Midcap 150 

Bearish  

Nifty Small cap 250 

Bullish 

Nifty Microcap 250 

Bullish  

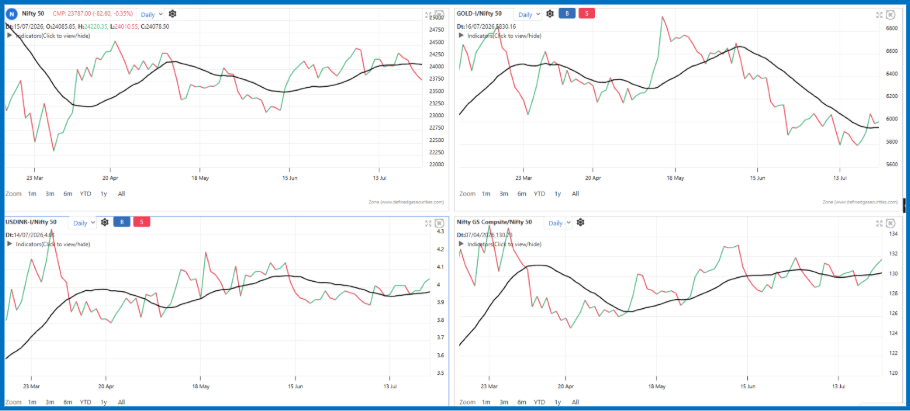
 Relative Strength of Major Asset Classes: 

Index 

Relative Trend 

Index 

Relative Trend 

Nifty 50 

Bearish 

Gold/Nifty50 

Bearish  

USDINR/Nifty50 

Bullish 

GSComposite/Nifty50 

Bullish 

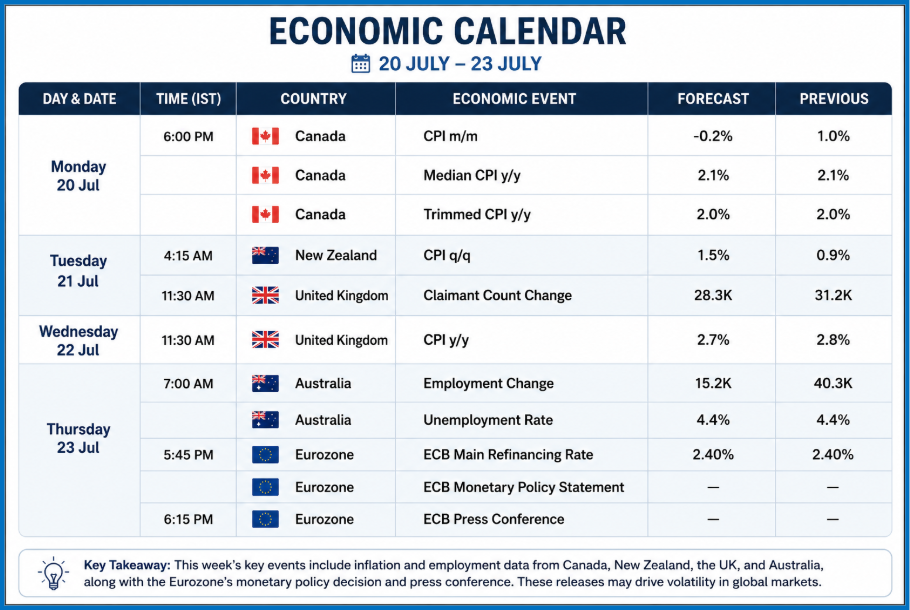
Events this week

This week features several important economic releases that could influence global financial markets. Investors will closely monitor Canada's inflation data, New Zealand and UK inflation and labour market reports, Australia's employment figures, and the European Central Bank's monetary policy decision. These events are expected to provide fresh insights into inflation trends, central bank policy outlooks, and the overall health of major economies, which may lead to increased volatility across equities, currencies, and interest rate-sensitive sectors. 

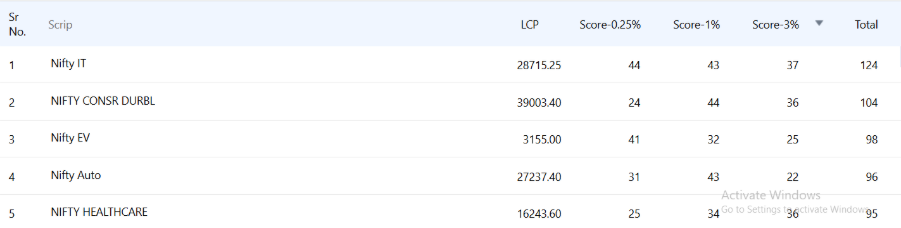
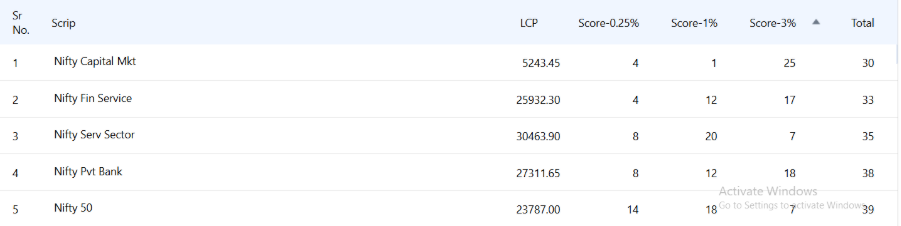
Sectors on Radar using Ultimate Matrix.

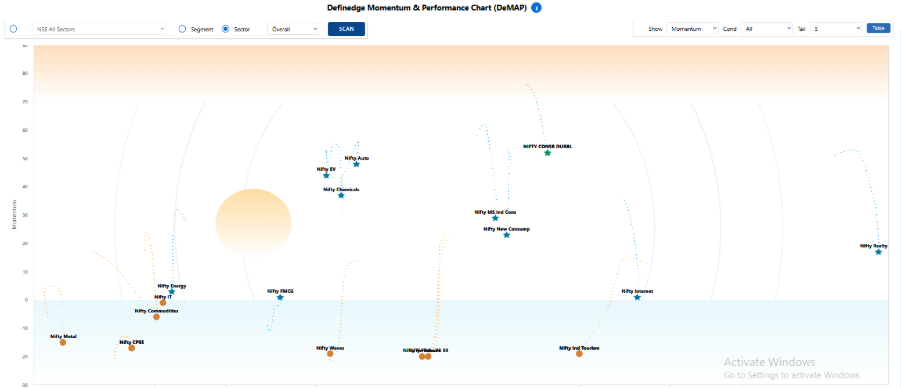
Definedge Momentum and Performance Chart  

DeMAP is divided into two parts: Sky and Water. Scrips above zero line are in Sky presented as stars. Scrips below zero line are in Water and presented as circle. You can view their last 10 session journey. Green Star (In the Sky) stocks are bullish and have strong momentum. Red Circle (In the Water) stocks are bearish. Blue Star (In the Sky) stocks are semi-bullish and Orange Circle (In the Water) stocks are semi-bearish.  DeMap   

Strong sectors 

Weak sectors 


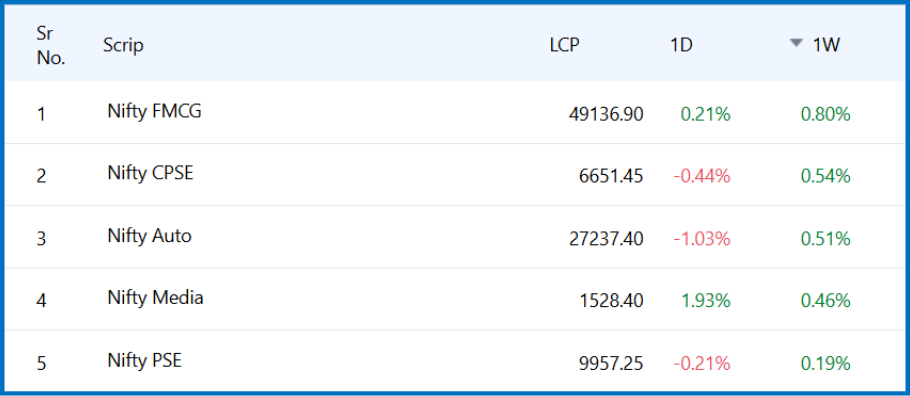
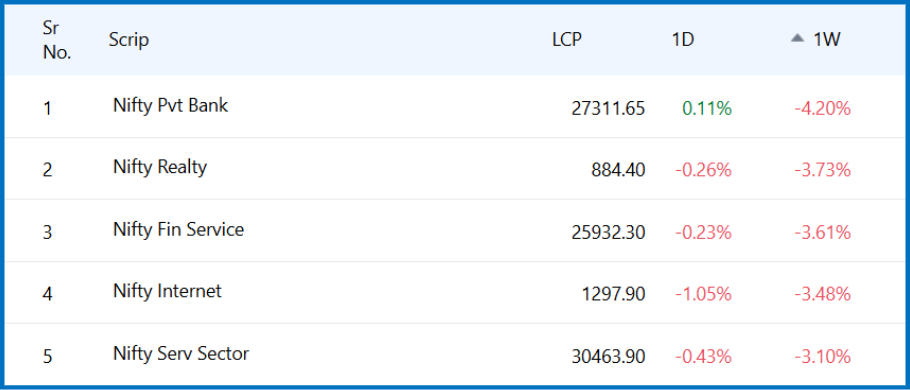
Top 5 & Bottom 5 sectors in this week

Top 5

Bottom 5

Stocks in focus

Nifty 500: Top Eagle stocks

In the Tradepoint and Zone web terminals, we have developed a scanner called the Eagle scanner. It considers the price setup on multiple timeframes, relative strength, matrix scores and pattern counter scores before scoring the stock. 

Below are the top 15 stocks in the Nifty 500 index based on the Eagle score. 

Sr No 

Scrip 

Total Eagle Score 

52-Week high 

52-Week Low 

ANANDRATHI 

24 

2176.2 

1108.2 

BLUEJET 

24 

1027.8 

325 

CEMPRO 

24 

1597.4 

503.3 

GODREJPROP 

24 

2407.9 

1434 

GRANULES 

24 

901.8 

432.6 

HONASA 

24 

478.8 

248.4 

IKS 

24 

1933 

1262 

J&KBANK 

24 

201.75 

97.35 

NUVAMA 

24 

1993.7 

1096.9 

10 

NYKAA 

24 

330.95 

200.14 

11 

OFSS 

24 

11685 

5964.5 

12 

PAYTM 

24 

1381.8 

930.6 

13 

PHOENIXLTD 

24 

2149 

1402.5 

14 

STARHEALTH 

24 

614.2 

416.55 

15 

WELCORP 

24 

1634 

710 

Stocks on Watchlist

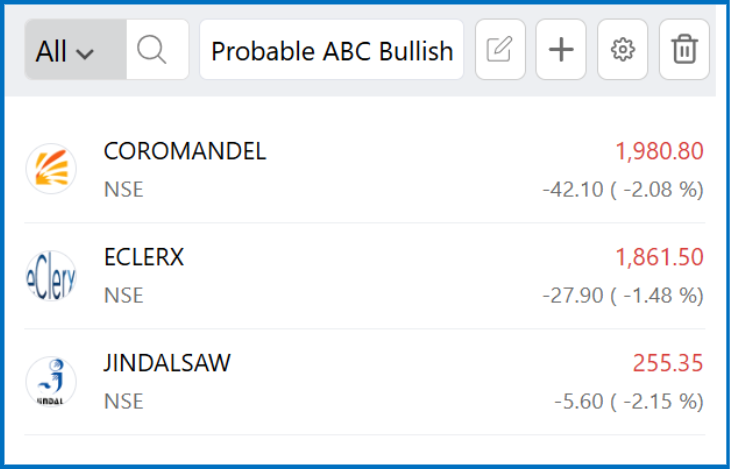
The stocks below have been shortlisted based ABC breakout based on our Point & Figure scanner, keep these stocks on your radar, as a confirmed breakout could lead to fresh trading opportunities. 

FII — DII activity

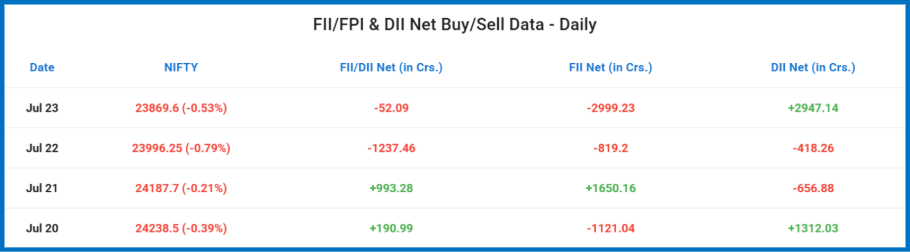
Foreign investors had a mixed week. They made a strong comeback on Tuesday with buying of around ₹1,650 crore, but the buying didn't last long. FIIs turned sellers again on Wednesday and stepped up their selling sharply on Thursday, pulling out nearly ₹3,000 crore in a single session. Overall, they remained cautious throughout the week. 

Domestic institutions continued to do what they've been doing for the past few months stepping in whenever the market came under pressure. They bought over ₹1,300 crore on Monday and followed it up with another ₹2,950 crore of buying on Thursday, which absorbed most of the heavy FII selling. Although DIIs were sellers on Tuesday and Wednesday, they still ended the week as net buyers. 

Overall, FIIs were net sellers of around ₹3,300 crore, while DIIs were net buyers of about ₹3,200 crore. Once again, domestic money helped balance the foreign selling, which continues to be one of the key reasons the market has remained relatively resilient. 

Stocks for the week

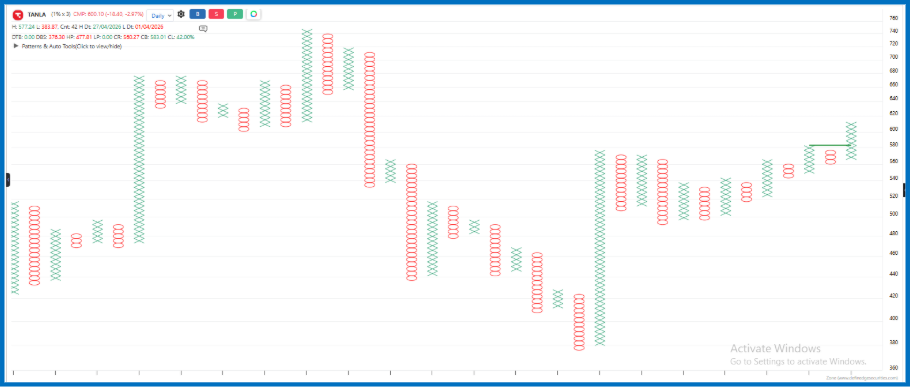
Three setups for the week ahead, sized for a swing horizon of one to three weeks rather than a single session. Each carries a defined invalidation level treat the stop-loss as non-negotiable rather than a suggestion, especially heading into a week with two earnings-heavy days. 

As always, position size before conviction: these are ideas to research further, not calls to act on directly. 

Stock 

Pattern  

Target 

Stop-loss 

Tanla Platforms Ltd 

Turtle breakout Follow Through  

₹XXX 

₹XXX 

Futures Open Interest Buildup

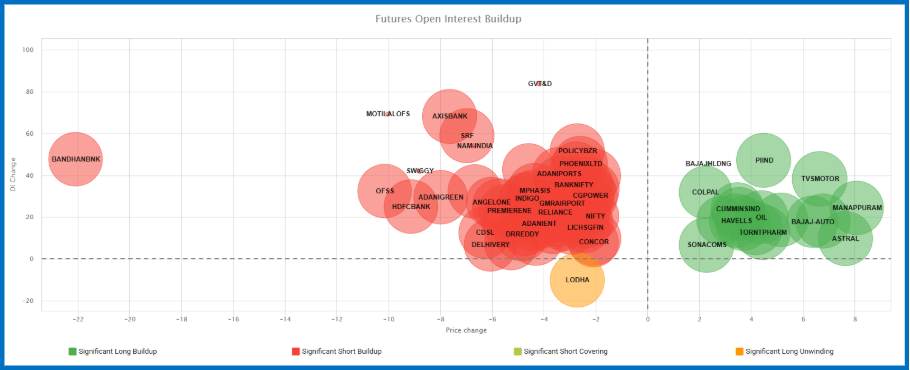
The futures market was dominated by significant short buildup this week, with a large number of stocks moving into the bearish quadrant. Stocks such as Reliance, Adani Ports, Axis Bank, Mphasis, CG Power, along with Nifty and Bank Nifty futures, witnessed a combination of falling prices and rising Open Interest, indicating that traders were building fresh short positions. 

On the positive side, significant long buildup was seen in a handful of stocks, including TVS Motor, PI Industries, Bajaj Holdings, Cummins India, Colgate-Palmolive, and Bajaj Auto. This suggests that while the broader market remained under pressure, traders continued to build bullish positions in select counters. 

Lodha was the only prominent stock to witness significant long unwinding, where both price and Open Interest declined, indicating that existing long positions were being closed. 

The size of each bubble represents the stock's Volume Percentile. Larger bubbles indicate unusually high futures trading activity compared to the past one year, making those buildups more meaningful. 

Overall, the weekly futures positioning remained tilted in favour of the bears, with significant short buildup clearly outweighing significant long buildup. While selective buying was visible in a few stocks, the broader positioning suggests traders preferred to add bearish bets during the week.  

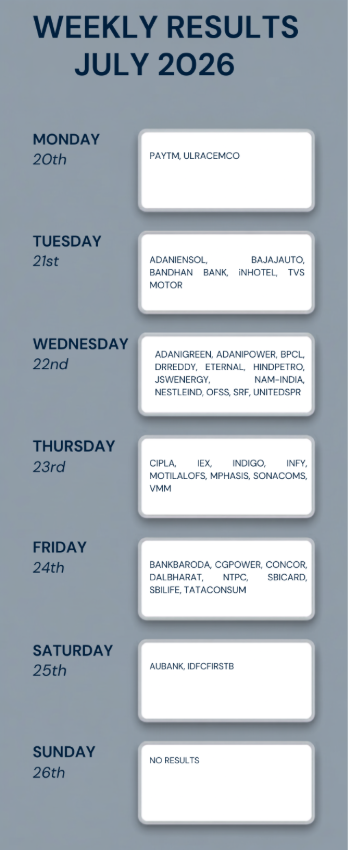
WEEKLY RESULT CALENDER

WEEKLY RESULT CALENDER

Learning from market history

Weeks like this one  steady grind, improving breadth, no panic  are deceptively hard to trade well, because there's no obvious danger to react to. The 2003–2007 and 2020–2021 bull phases both had stretches that felt exactly this uneventful, and the investors who did best through them were the ones who stayed boring: sized positions consistently and didn't chase strength just because it was quiet. 

The psychology worth naming is complacency, not fear. It's the week after a string of green closes that stop-losses quietly get moved further away "just this once." History's version of this lesson repeats often enough that it's worth writing down before it happens again, not after. 

"The four most expensive words in the market are 'this time it's different.'" 

— attributed to Sir John Templeton


The Market Pulse

Weekly Indian Equity Intelligence — Issue #1

Data sourced from NSE, BSE, SEBI

Not investment advice. For educational use only.

Entity & Registrations

Definedge Securities Broking Private Limited

Registration No.

INH000010344

BSE Enlistment

5631

CIN

U65990PN2021PTC198378

Registered Office Address: 2nd Floor, Ambashish, Lane No. 9, Pakharbag, NDA Pashan Road, Bavdhan, Pune, Maharashtra, 411021

Compliance and Grievance Officer: Bhagyashree Zad

Contact No: 9922918835, 9867677402

Email ID: [email protected]

This report has been prepared by Research Analyst and is solely for information of the recipient only. The report must not be used as a singular basis of any investment decision. The views herein are of a general nature and do not consider the risk appetite or the particular circumstances of an individual investor; readers are requested to take professional advice before investing. Nothing in this document should be construed as investment advice. Each recipient of this document should make such investigations as they deem necessary to arrive at an independent evaluation of an investment in securities of the companies referred to in this document (including merits and risks) and should consult their own advisors to determine merits and risks of such investment.

The information and opinions contained herein have been compiled or arrived at, based upon information obtained in good faith from sources believed to be reliable. Such information has not been independently verified and no guaranty, representation of warranty, express or implied, is made as to its accuracy, completeness or correctness. All such information and opinions are subject to change without notice. Descriptions of any company or companies or their securities mentioned herein are not intended to be complete. Research Analyst is not obliged to update this report for such changes. Research Analyst has the right to make changes and modifications at any time.

This report is not directed to, or intended for display, downloading, printing, reproducing or for distribution to or use by, any person or entity who is a citizen or resident or located in any locality, state, country or other jurisdiction where such distribution, publication, reproduction, availability or use would be contrary to law or regulation or what would subject Research Analyst or its affiliates to any registration or licensing requirement within such jurisdiction. If this report is inadvertently sent or has reached any person in such country, especially, United States of America, the same should be ignored and brought to the attention of the sender. This document may not be reproduced, distributed or published in whole or in part, directly or indirectly, for any purposes or in any manner. It should not be considered to be taken as an offer to sell or a solicitation to buy any security. This document is not, and should not, be construed as an offer or solicitation of an offer, to buy or sell any securities or other financial instruments. This report should not be construed as an invitation or solicitation to do business with Research Analyst.

Research Analyst do not take any responsibility, financial or otherwise, of the losses or the damages sustained due to the investments made or any action taken on basis of this report.

The following Disclosures are being made in compliance with the SEBI Research Analyst Regulations 2014 (herein after referred to as the Regulations)

Definedge Securities Broking Private Limited ("Research Entity") is registered with SEBI as Research Analyst with Registration No. INH000010344, BSE Enlistment No.: 5631. The research entity got its SEBI registration on 21-Oct-22 and is engaged in research and recommendation Services. The focus of Research entity is to provide research and recommendations services to the clients. Analyst aligns its interests with those of the client and seeks to provide the best suited services.

  • Research entity has no material adverse disciplinary history as on the date of publication of this report.
  • Research entity has no associates
  • Research entity or its associate or Research Analyst or his relative have no financial interest in the securities recommended.
  • There are no actual or potential conflicts of interest arising from any connection of Research entity or its associate or Research Analyst or his relative to or association with any issuer of products/ securities, including any material information or facts that might compromise its objectivity or independence in the carrying on of Research Analyst services. Such conflict of interest shall be disclosed to the client as and when they arise.
  • Research entity or its associate or Research Analyst or his relative, may have actual/beneficial ownership of one per cent or more securities of the subject company, at the end of the month immediately preceding the date of publication of the research report or date of the public appearance or research recommendation.
  • Research entity or its associate or Research Analyst or his relative has no connection or association of any sort with any issuer of products/ securities recommended herein.
  • Research entity or its associate or Research Analyst or his relative has no actual or potential conflicts of interest arising from any connection to or association with any issuer of products/ securities, including any material information or facts that might compromise its objectivity or independence in the carrying on of research and recommendations services.
  • Research entity or Research analyst or its associates has not received any kind of remuneration or consideration form the products/ securities recommended herein.
  • Research entity or Research analyst or its associates have not received any compensation from the subject company in past 12 months.
  • Research entity or Research analyst or its associates have not managed or co-managed the public offering of Subject Company in past 12 months.
  • Research entity or Research analyst or its associates have not received any compensation for investment banking or merchant banking of brokerage services from the subject company in past 12 months.
  • Research entity or Research analyst or its associates have not received any compensation for products or services other than investment banking or merchant banking or brokerage services from the subject company in the past twelve months
  • Research entity or Research analyst or its associates have not received any compensation or other benefits from the subject company or third party in connection with the research report or research recommendations.
  • Research entity or Research analyst or its associates have not received any compensation for products or services from the subject company in past 12 months.
  • The subject company is or was not a client of Research entity or Research analyst or its associates during twelve months preceding the date of distribution of the research report and recommendation services provided.
  • Research Analysts or its associates has not served as an officer, director or employee of the subject company.
  • Research Entity or Research Analysts has not been engaged in market making activity of the subject company
  • The research analyst has not used/ used artificial intelligence tools for preparation of the research report.